These sample Mission Plans demonstrate several of the ways to create output in FreeFlyer. After exploring these Mission Plans, continue to the Generating Output Guide for more information.
Jump to a Mission Plan Description:
Mission Plan |
Engineer |
Mission |
• |
• |
|
• |
• |
|
• |
• |
|
• |
• |
|
• |
• |
|
• |
• |
|
• |
• |
|
• |
• |
|
• |
• |
|
• |
• |
|
• |
• |
|
• |
• |
|
• |
• |
|
• |
• |
|
• |
• |
|
• |
• |
|
• |
• |
|
• |
• |
|
• |
• |
|
• |
• |
|
• |
• |
|
• |
• |
|
• |
• |
|
• |
• |
|
• |
• |
|
• |
• |
|
• |
• |
|
• |
• |
|
• |
• |
|
• |
• |
|
• |
• |
|
• |
• |
|
• |
• |
|
• |
• |
|
• |
• |
|
• |
• |
Console
This Mission Plan demonstrates the use of the FreeFlyer Console. The Console is a convenient place to display text and data. The size, location, background color, font color, font type, and title of the Console can be controlled through FreeFlyer Script.
The Console can be moved during a Mission Plan. You can hide the Console to focus attention elsewhere during a Mission Plan, and use the Show method to display it again. The contents of the Console can be recorded to an output file using the WriteToFile method. See also the Multiple Console Windows Sample Mission Plan.
Create View From ProximityZone
This Mission Plan demonstrates how to set a Viewpoint on a ProximityZone associated with a Spacecraft. This technique is useful to create a dynamically controllable view, with more degrees of freedom that using the ViewWindow.Instantaneous methods.
A Spacecraft with a generic ProximityZone and a ViewWindow are created in the Object Browser - the ViewPoint must be created and utilized in FreeFlyer Script. The ProximityZone Viewpoint is useful for creating a stable platform to visualize Spacecraft slews, but can also be rotated or translated independently of the Spacecraft.

Viewpoint centered on a Spacecraft's Proximity Zone
DataTableWindow
This Mission Plan demonstrates use of the DataTableWindow in a simple orbit propagation scenario. See also the Report Sample Mission Plan as an alternate approach. The DataTableWindow offers allows greater control of titles, and update modes than the Report command.
The DataTableWindow can be updated automatically every time a Spacecraft is stepped or maneuvered, or it can be updated manually using the Update command. In this example, the DataTableWindow is set to update automatically using the Update command.

DataTableWindow showing contact flags to four GroundStations
EntryFootprintWithCoastlineOffsets
This Mission Plan displays a Spacecraft re-entry trajectory and footprint of potential impact locations. A 3-sigma ellipse is drawn to represent the distribution of the impact coordinates. Coastlines are drawn at distances of 50 and 100 km for the United States, and 150 and 200 km for international land masses.

Entry footprint drawn alongside coastline offsets of varying distances
Globe Layers
This Mission Plan demonstrates how to configure Earth globe layers including coastlines, coastline offsets, and political boundaries such as state and country borders.

Earth globe layers showing coastlines, coastline offsets, and political borders
GraphicsOverlay - Sensor Path
This Mission Plan demonstrates the use of the GraphicsOverlay Object to visualize mean local time and indicate the quality of the images taken by the Cloudsat spacecraft.
The GraphicsOverlay Triangle Strip shape type is used to display the path of the sensor on the Earth. The color gradients are calculated using the ColorTools.InterpolateColorRGB method. Yellow indicates the image was taken near noon, mean local time while blue signifies the image was taken closer to midnight, mean local time.

Graphics Overlay displaying the Cloudsat sensor path
GraphicsOverlay - Shape Types
This Mission Plan demonstrates the use of the Graphics Overlay object. Each section of FreeForm script demonstrates how to add a different shape type to the overlay.
Shape types demonstrated:
•Lines •Points •Triangle Strip •Translucent Strip with fading color •Triangles •Annotation •Icon |
In this example, the overlay is fixed to the Earth and does not move over time. See the Graphics Overlay Spacecraft Attitude sample Mission Plan for additional examples of overlay functionality.

Graphics Overlay displaying a variety of Shape Types
GraphicsOverlay - Spacecraft Attitude
This Mission Plan demonstrates the use of the Graphics Overlay object. In this example, the overlay is fixed to a Spacecraft with a dynamic attitude. The overlay displays 3 triangle strips visually displaying the changing attitude over time. See the Graphics Overlay Shape Types sample Mission Plan for additional examples of overlay functionality.

Graphics Overlay displaying 3 rings around a Spacecraft
This Mission Plan demonstrates the use of a GraphicsOverlay object to visualize the gravitational forces of Earth and the Moon.

GraphicsOverlay representing gravitational forces
GridWindow
This Mission Plan shows a Spacecraft in a deteriorating circular low-Earth orbit. The Mission Plan uses ImpulsiveBurns to maintain the orbit for 1 day and uses the GridWindow object to monitor the Spacecraft's state.

A GridWindow displaying a Spacecraft's state
Heat Map Procedure
This Mission Plan demonstrates how to display a two dimensional data set using the HeatMap Procedure. The magnitude of the data is represented by the colors in the legend.
Through the HeatMapPreferences Struct, the user can define the maps accuracy and density.

Heat Map of the Rosenbrock Function
Import View Configuration
This Mission Plan demonstrates how to import a ViewWindow Configuration that specifies viewpoints and object display settings.

Imported 2D Map ViewWindow Configuration
Multiple Console Windows
This Mission Plan demonstrates the use of multiple Console Windows. Various Console Window objects can be created in script and they can each be manipulated throughout the Mission Plan.
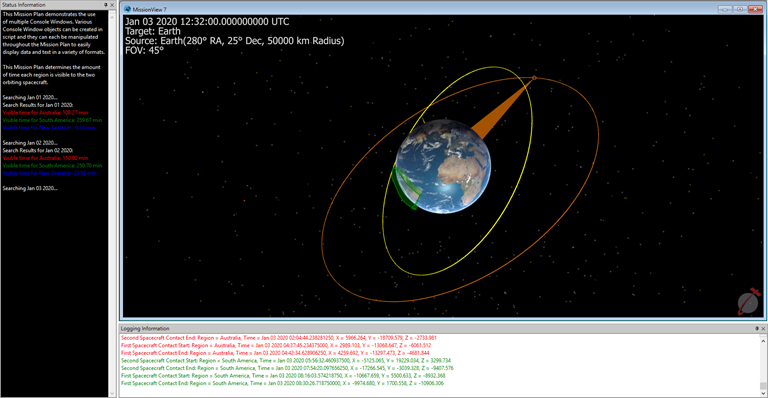
Multiple Console Windows Mission Plan Output
Object Icons
This Mission Plan demonstrates the use of icon images to represent Spacecraft, GroundStations, and CelestialObjects in a ViewWindow.

Icon images representing the planets and a satellite
OutputLayoutManager
This Mission Plan demonstrates how FreeFlyer can be used to display the contact between a Spacecraft and two GroundStations by using the OutputLayoutManager to configure ViewWindows. This Mission Plan displays the workspace in full screen mode.
The Mission edition version of this Mission Plan contains a UserInterface that allows the user to specify if the workspace is displayed in full screen or not.

The OutputLayoutManager can be used to configure ViewWindows
OutputLayoutManager - Unconstrain Windows
This Mission Plan demonstrates how FreeFlyer can be used to display the contact between a Spacecraft and two GroundStations, and move output view windows outside of the FreeFlyer Workspace by using the OutputLayoutManager.
The Mission edition version of this Mission Plan contains a UserInterface that allows the user to specify if output windows should be unconstrained.

The OutputLayoutManager can be used to unconstrain windows from the Workspace
Particle Flux Model Visualization
This Mission Plan demonstrates the implementation of the NASA AP8/AE8-MAX/MIN particle flux models in FreeFlyer using the ParticleFlux method. AP8 and AE8 correspond to the proton and electron flux models, respectively. The MAX/MIN options correspond to the Sun’s activity according to the 11 year solar cycle. With the Mission tier of FreeFlyer, a UserInterface object is displayed to allow the user to specify the model properties such as the particle type, solar cycle, particle energy levels, etc. The Engineer tier allows the user to change these values through FreeForm script.

At a default height of 700 km over the Earth's surface, the proton flux values are color coded and the South Atlantic Anomaly can easily be picked out.
The flux values above a certain flux threshold are displayed and color coded using a GraphicsOverlay object. The color of each point depends on the particle flux seen at that point in space. See the ISS Over SAA sample Mission Plan for an example of using the ParticleFlux and ParticleFluxTimes methods to determine when a Spacecraft enters and exits areas of high particle flux.
Plot
This Mission Plan demonstrates the use of the Plot command. See also the PlotWindow Sample Mission Plan, which allows more control of the display.

Output Plot of Spacecraft Height
PlotWindow
This Mission Plan demonstrates the use of the PlotWindow Object. See the Plot Sample Mission Plan, which demonstrates use of the Plot command. The PlotWindow allows greater control of titles, labels, and update modes than the Plot command.
The PlotWindow can be updated automatically every time a Spacecraft is stepped or maneuvered, or it can be updated manually using the Update command.
PlotWindow - Batch Updates
This Mission Plan demonstrates how to display multiple data series on a PlotWindow using a batch update. In this example, three plot series objects are configured.
Batch updates allow the user to perform consolidated updates to a PlotWindow object at a single instance in time.

Output PlotWindow
PlotWindow - FreeFlyer Script
This Mission Plan demonstrates the use of the PlotWindow Object in FreeFlyer script. The PlotWindow Object allows the user to control properties of the data, titles, labels, and update modes via FreeFlyer Script.

Output Plot created in FreeForm Script
PlotWindow - Save Output Image And Data
This Mission Plan demonstrates how to use the PlotWindow SaveImage and SaveData methods to create an output data file or image file that captures the current state of the plot.
Output files created:
•../_Output_Files/PlotWindowImage.jpg •../_Output_Files/PlotWindowData.jpg |
PlotWindow - Scatter Series
This Mission Plan demonstrates how to display series data on a PlotWindow and add data points at various times in the Mission Sequence. This can be used to display only the most important data at different times, or to color-code the data during an event. In this example, this technique is used to color-code a plot of SMA while a Spacecraft is maneuvering. The plot will be red during the maneuver and blue otherwise.

Output Plot of SMA before, during, and after a Maneuver
PlotWindow - Series Color Palette
This Mission Plan demonstrates how to create a PlotWindow with custom SeriesColorPalettes within FreeFlyer. The UserInterface allows you to select between Qualitative, Sequential, and Diverging SeriesColorPalettes.

Output PlotWindow showcasing a variant color scheme
Report
This Mission Plan demonstrates use of the Report command generate tracking data for four ground stations. The Report command has options to report to a file or to the screen. This Mission Plan generates a report of the Spacecraft PassData method to a file. The PassData method provides a set of angle, range, and contact time information in a concise format. This Mission Plan also reports the Spacecraft Contact method to the screen. The Contact method returns a '1' if an object is in view of a spacecraft sensor and a '0' if it is not. See also the DataTableWindow and ReportInterface Sample Mission Plans for possible alternate approaches.
Output Excerpt:
Spacecraft1.ElapsedMinutes Spacecraft1.Contact(GroundStation1) 945.0000000 0.0000000 950.0000000 1.0000000 955.0000000 1.0000000 960.0000000 0.0000000 965.0000000 0.0000000 |
Report Interface
This Mission Plan demonstrates use of the ReportInterface in a simple orbit propagation scenario to generate tracking data for four GroundStations. See also the Report Sample Mission Plan as an alternate approach. The ReportInterface offers allows greater control than simply using the Report command by allowing you to choose whether to append new data to an existing file.

Output generated in a text file using the ReportInterface object
StarMapEclipseView
This Mission Plan demonstrates the use of FreeFlyer display a solar eclipse using the StarMap Viewpoint object. The Mission Plan shows the view of a solar eclipse from March 8, 2016 as seen from Woleai in the Federated States of Micronesia. It provides a 3D view as seen from the ground, and a StarMap view that shows a close-up view of the eclipse.

Output generated using the StarMap Viewpoint
This Mission Plan demonstrates the use of a StarMap Viewpoint object to show the coverage of two star trackers on a spacecraft during one orbit, using a custom StarField object from an imported Star Catalog of selected stars. It provides a 3D view of the spacecraft and the orientation of its sensors, and reports the visibility times of stars as seen by each star tracker.
Output generated using StarMap Viewpoint showing sensor swaths from two star trackers
Sun Pointing Arrays Rotating ThreeDModel
This Mission Plan demonstrates rotating the solar arrays of an external 3D model to point toward the Sun. The ThreeDModel Object is used to import the Cloudsat.3ds model and create two groups; a Main Body, and Solar Arrays group. A pivot point is set up for the Solar Arrays to allow the group to rotate and point toward the Sun.

Output plot showing solar panels of 3ds model pointing toward the Sun.
View
This Mission Plan demonstrates the use of the View command. See also the ViewWindow Sample Mission Plan, which allows more control of the display.

Output generated using the View command
ViewWindow
This Mission Plan demonstrates use of the ViewWindow in a simple orbit propagation scenario. See also the View Sample Mission Plan as an alternate approach. The ViewWindow offers allows greater control of titles, display properties, view points and update modes than the View command.
The ViewWindow can be updated automatically every time a Spacecraft is stepped or maneuvered, or it can be updated manually using the Update command. In this example, the ViewWindow is set to update automatically via the Properties page of the ViewWindow object editor.
This ViewWindow has been configured with two different Viewpoints. Try changing to Viewpoint2 by selecting it from the 'View Point' menu shown in the Output Properties tab on the right side of the Output screen.

Output generated using a ViewWindow object with 2 Viewpoints
ViewWindow - Save Output Image
This Mission Plan demonstrates how to use the ViewWindow SaveImage method to create an output image file that captures the current state of the view.
Output file created:
•../_Output_Files/ViewWindowImage.jpg |
Watch
This Mission Plan demonstrates use of the Watch Command in a simple orbit propagation scenario. See also the WatchWindow Sample Mission Plan as an alternate approach. The WatchWindow offers additional flexibility and greater control of titles and update modes than the Watch command.
WatchWindow
This Mission Plan demonstrates use of the WatchWindow in a simple orbit propagation scenario. See also the Watch Sample Mission Plan as an alternate approach. The WatchWindow offers allows greater control of titles and update modes than the Watch command.
The WatchWindow can be updated automatically every time a Spacecraft is stepped or maneuvered, or it can be updated manually using the Update command. In this example, the WatchWindow is set to update automatically via the Properties page of the WatchWindow object editor.

Output WatchWindow showing the current value of BLJ2 Semi-Major Axis
WindowOverlay
This Sample Mission Plan is based on the ISS Visualization Demo and highlights the capabilities of the WindowOverlay object.

WindowOverlay Capability Demonstration
Working With ThreeDModels
This Mission Plan demonstrates the different ways in which the ThreeDModel object could be used to manipulate external .3ds 3D models. Using the ThreeDModel object allows for more options in terms of manipulating groups included in a 3D model (e.g. rotating solar arrays).

Manipulating an external 3D model.