These sample Mission Plans show examples of working with the FreeFlyer objects relating to coverage and contact analysis, such as Spacecraft and GroundStations. After exploring these Mission Plans, continue to the Coverage and Contact Analysis Guide for more information.
Jump to a Mission Plan Description:
Mission Plan |
Engineer |
Mission |
• |
• |
|
• |
• |
|
• |
• |
|
• |
• |
|
• |
• |
|
• |
• |
|
• |
||
• |
• |
|
• |
• |
|
• |
• |
|
• |
• |
|
• |
• |
|
• |
• |
|
• |
• |
|
• |
• |
|
• |
• |
|
• |
• |
|
• |
• |
|
• |
• |
|
• |
• |
|
• |
• |
|
• |
• |
|
• |
• |
|
• |
• |
|
• |
• |
|
• |
• |
|
• |
• |
|
• |
• |
|
• |
• |
|
• |
• |
|
• |
• |
|
• |
• |
|
• |
• |
|
• |
• |
|
• |
• |
|
• |
• |
|
• |
• |
|
• |
• |
|
• |
• |
|
• |
• |
|
• |
• |
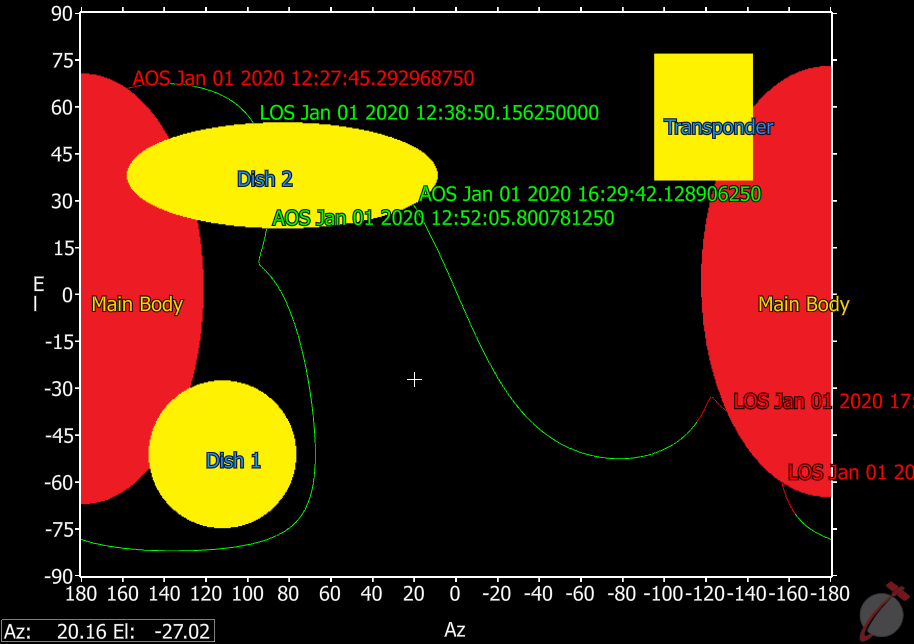
Blockage Diagram
This Mission Plan demonstrates how to read in a blockage diagram to the BlockageDiagram object and then do line of sight calculations. AOS and LOS are represented in the output with colored lines and annotations, indicating whether the satellite was being occulted by the Earth in red or not in green. More information regarding the BlockageDiagram object is provided in the Blockage Diagrams section of the Coverage and Contact guide.
Cardinal Points
This Mission Plan demonstrates the use of the CardinalPoints interval method in FreeFlyer to calculate the times at which a Spacecraft will be at a Cardinal Point relative to the Sun. The times are reported to a DataTableWindow, along with the corresponding alpha angle (the angle between the Spacecraft and the Sun). In the ViewWindow, each cardinal point is marked using a GraphicsOverlay object. In addition, the alpha angle is plotted as a function of time.

Example of the output from the CardinalPoints.MissionPlan.
Chain Visibility
This Mission Plan demonstrates the use of FreeFlyer to calculate chains of visibility between multiple ground and space assets. The available assets are: GroundStations in Madrid and Canberra, the TDRS constellation, and a generic satellite with a 15000 km orbit.
The chain is complete when Canberra is in contact with Spacecraft1, Spacecraft1 is in contact with one or more of the TDRS satellites, and those TDRS satellites are also in contact with Madrid.
At these times, green vectors will be shown indicating the path of data transfer and the contact start and end times will be reported to the Console.

Vectors visualizing chain access using the TDRS constellation
Circular Region
This Mission Plan demonstrates how to use FreeFlyer Script to create a Circular Region.

Circular Region on the east coast of the U.S.
ContactAndLightTimes
This Mission Plan reports the times when a Spacecraft is in contact with a Ground Station while also not being in the Earth's shadow. Two interval methods, Spacecraft.ContactTimes and Spacecraft.ShadowTimes, are used and the overlapping times are reported to the Console. The logic used in this Mission Plan can be used for other interval methods as well.

Plot showing union of contact and light times
CoordinateSystems
This Mission Plan demonstrates the creation of three custom CoordinateSystems (CS) centered on a Spacecraft. A Local-Vertical-Local-Horizontal (LVLH) CS is used to visualize the default Spacecraft reference frame in FreeFlyer. A SunPointing CS is used to orient the Spacecraft so that it constantly points towards the Sun. A Body Coordinate System (BCS) is used to visualize the Spacecraft's divergence from the neutral LVLH state as it points towards the Sun.

Rotating BCS & LVLH CoordinateSystem illustrations
EIRP
This Mission Plan demonstrates FreeFlyer's ability to calculate and display EIRP values for a GEO spacecraft with user supplied dwell location and sensor pointing angle. The user inputs spacecraft dwell location and Antenna Gain, as well as sensor X (longitude) and Y (latitude) offsets. The sensor footprint will be shown using a PointGroup, and regions in the footprint are color-coded by dB dropoff from peak intensity: red (peak) --> violet (low).

PointGroup illustrating dB dropoff
Elliptical Sensor
This Mission Plan demonstrates how to set up an elliptical shaped Sensor mask. 100 masking points are defined using polar coordinates calculated from input values of semi-major and semi-minor axes cone half-angles. By default, the semi-major axis will be aligned with the x-axis of the Spacecraft, while the semi-minor axis will be aligned along y-axis.

3D View of Elliptical Sensor
GPS DoP
This Mission Plan plots the Dilution of Precision (DoP) values for one specific location on the ground over the course of the day. The relative locations of the GPS satellites visible to the receiver are plotted as well.
A variable setting is used to control whether the Mission Plan sets up a Socket to go to the celestrak website to get the latest GPS TLE set, or whether a file (GPS.tle) containing the TLEs is used.

GPS satellites in view of a ground site near Washington, DC
To learn more about topics related to this sample Mission Plan, see the Sockets Guide.
Groundstation
This Mission Plan generates tracking data for four GroundStations, one from the Station Geodetics File and three with custom locations defined manually in the GroundStation object editor. The Mission Plan generates a report of the PassData Interval Method. PassData provides a set of angle, range, and contact time information in a concise format.

2D Map displaying 4 GroundStations and 1 Spacecraft Ground Track
To learn more about topics related to this sample Mission Plan, see the GroundStations page and the Interval Methods page of the Coverage and Contact Analysis Guide.
GroundVehicle
This Mission Plan demonstrates the configuration and propagation of the GroundVehicle object. The initial GroundVehicle state is saved and then propagated using a "Simple Motion" model for one day. After one day the initial GroundVehicle state is restored and then propagated again using the "Waypoint Motion" model.

2D Map showing a GroundVehicle's Propagation
Hurricane Coverage
This Hurricane Observation Mission Plan demonstrates the use of FreeFlyer to provide coverage analysis for natural disasters such as hurricanes. This scenario presents a hurricane forming off of the coast of Africa and making its way across the Atlantic to make landfall in the Carolinas. The GOES-12 (GEO), NOAA-11 (LEO), and NOAA-15 (LEO) observation satellites are used to track the movement of the hurricane.
The NOAA and GOES initial states are read from an SGP4 TLE (two-line element) file, and the states are propagated by FreeFlyer. The Contact method is used to report the contact start and end times to the Console. The Access Interval Method is used to generate report files detailing the entry epoch, exit epoch, and duration of each contact.

Map of a simulated hurricane approaching the east coast of the United States
ISS Over SAA
This Mission Plan demonstrates the implementation of the NASA AP8/AE8-MAX/MIN particle flux models in FreeFlyer. The Mission Plan simulates the ISS in orbit, and determines entry/exit times and locations whenever the ISS encounters areas of high particle flux associated with the South Atlantic Anomaly (SAA). The Spacecraft.ParticleFlux method is used to determine the particle flux values. The values are then plotted as a function of the geodetic latitude. The interval method, Spacecraft.ParticleFluxTimes, is used to determine the time when the ISS enters and exits areas of high particle flux.

A GraphicsOverlay object is used to view the South Atlantic Anomaly. The ParticleFluxTimes interval method is used to find the entry and exit times of the ISS.
See the Particle Flux Model sample Mission Plan for an example on visualizing the particle flux magnitudes at different altitudes and locations.
Link Budget
This Mission Plan demonstrates the use of FreeFlyer to provide a link budget analysis. A custom GroundStation, Hartebeesthoek, and a LEO Spacecraft are used for this analysis. Communication Link parameters are specified through the 'User Inputs' FreeForm script sections for the Engineer version of this Mission Plan. In the Mission version of this Mission Plan, communication link parameters are specified using custom User Interface panels, generated using the UserInterface object in FreeFlyer.
If “Run Monte Carlo?” is selected to be “Yes”, FreeFlyer will apply some Gaussian noise to the Spacecraft position, and then maneuver the Spacecraft. If Monte Carlo is not selected, a maneuver is not performed. Once the analysis is complete, a summary report is generated.

Output of PlasmaSat Carrier to Noise and Elapsed Minutes over multiple Monte Carlo Simulations.
Link Margin
This Mission Plan calculates the link margin for given GroundStation and spacecraft transmitter, receiver, and antenna properties. Carrier-to-Noise Ratio and station elevation plots are generated.

Output Plots of C to N Ratio and Station Elevation
Mutual Visibility
This Mission Plan demonstrates how to determine the times of mutual contact between a Sensor on a Spacecraft and a GroundStation. A VisibilityCalculator is set up with two Segments, one with the GroundStation as the observer and one with the Sensor as the observer. The VisibilityCalculator.VisibilityTimes interval method is used to identify the times when both Segments are complete.
OpticalLink Earth Atmospheric Losses
This Mission Plan demonstrates how to model and visualize the individual atmospheric loss components affecting an optical communication link between a ground station on Earth and a low Earth orbit (LEO) spacecraft. The simulation includes modeled losses from rain attenuation, atmospheric scattering due to visibility conditions, and fixed contributions from scintillation. Each component is computed or approximated using the OpticalLink.AtmosphericLossParameters properties and corresponding loss functions. The resulting loss values are plotted over a 2-day simulation to illustrate how Earth-based environmental factors impact link performance in optical systems.

Plot of Earth Atmospheric Loss Components
OpticalLink Mars Relay
This Mission Plan models a deep-space optical communications link between a Mars-orbiting relay satellite and a ground station on Earth. The simulation evaluates the performance of the OpticalLink over time, accounting for the varying Earth-Mars geometry during interplanetary motion. A VisibilitySegment is used to ensure that computations are only performed when the Earth station is above the horizon as seen from the Mars relay. The output includes a visualization of Mars Relay Spacecraft and Plots of SNR, bit rate, and received power as functions of time.

3D view of Spacecraft around Mars
OpticalLink Mars Rover
This Mission Plan models an optical uplink from a Mars surface rover to an orbiting relay satellite, showcasing FreeFlyer’s ability to evaluate time-varying performance of surface-to-space optical communication links. The simulation configures a transmitter on the Martian surface and an orbiting receiver, using 32-PPM modulation to assess achievable bit rates and received power throughout visibility windows. The scenario highlights how communication geometry, modulation parameters, and receiver sensitivity influence data throughput for planetary surface assets.

3D view of contact between Mars orbiting Spacecraft and rover on the surface
OpticalLink Venus In Field of View
This FreeFlyer Mission Plan simulates the reduction in receiver sensitivity for an optical communications system when a bright planetary body (Venus) moves into the field of view of the receiving terminal. It models a downlink scenario between a spacecraft (sc) and a ground station (gs) and compares two receiver configurations: direct detection (Avalanche Photodiode) and coherent detection. The simulation evaluates the impact of Venus as a background light source on both receiver types and visualizes the sensitivity degradation and angular separation between Venus and the optical boresight.

Plot of sensitivity with Venus in the Field of View
OpticalLink Walker Constellation
This Mission Plan demonstrates the use of the OpticalLink object to analyze Inter-Satellite Links of a Walker Constellation. This scenario presents a Walker Constellation with two planes of 3 satellites at 7000 km and 8000 km. The user selects on satellite as the "transmitter" spacecraft and the rest of the spacecraft reprsent the "receivers". The OpticalLink is set up using the "OOK-RZ" modulation type and a near-infared wavelength of 1550 nm. The transmitter spacecraft have a beam divergence of 10 urad representative of a narrow laserbeam. The receiver spacecraft have an aperture diameter of 20 cm. The ViewWindow showcases the inter-satellite links using Vectors and PlotWindows demonstrate the correlation of range between satellites, computed receiver power, and link margin.

3D view of Walker Constellation
Pass Data With List Of GroundStations
This Mission Plan demonstrates the use of FreeFlyer Interval Method Spacecraft.PassData() to calculate passes between a Spacecraft and a List of GroundStations. Interval Methods provide a means to precisely calculate the entry and exit times for a specified event. The precise time for each event can be calculated to millisecond-level accuracy; the accuracy does not depend on the spacecraft’s propagation step size. Two configuration settings are used to control the accuracy of the event times: FF_Preferences.IntervalMethodSkipAccuracy and FF_Preferences.IntervalMethodStopAccuracy.

List of GroundStations calculating PassData with a Spacecraft
Point Group
This Mission Plan demonstrates FreeFlyer's ability to determine coverage analysis using a PointGroup on the Earth and two spacecraft, one LEO and one GEO. As the GEO Spacecraft sensor "sees" the points, it will color them light blue, and as the LEO Spacecraft sensor "sees" points, it will color them green.
Notice that the colors of the points persist once they have been "seen" once. This is occurs because the LEOCoverageArray and GEOCoverageArray arrays do not reset after each loop, thereby maintaining past knowledge of whether each point has been seen or not.
This Mission Plan also generates an output plot and report showing the number and percentage of points seen by each of the sensors.
To learn more about topics related to this sample Mission Plan, see the PointGroups page of the Coverage and Contact Analysis Guide.

PointGroup Coverage by LEO and GEO Spacecraft
Point Group Color By Revisit
This Mission Plan demonstrates how to use the PointGroup.Coverage(Spacecraft, CoverageArray, RevisitArray, InViewArray) method signature. The Revisit Array is populated with information on how many times each point in the PointGroup has been seen by the sensor on Spacecraft1. The points are color-coded according to how many times they have been seen.

5000 Points showing Revisit statistics
Point Group From Region
This Mission Plan demonstrates a useful aspect of coverage analysis in FreeFlyer. The Region object can be used to identify when a Spacecraft is over a certain area on the Earth's surface, or when a Spacecraft Sensor 'sees' a region. The PointGroup object is designed to support sensor coverage analysis, where sensor contact with each point is computed.
This Mission Plan demonstrates how to use a Region to initialize the location of the points in a PointGroup, thereby 'filling' the Region with points. This can be useful when the boundaries of an area of interest are known, and detailed coverage reports are desired.
You can change the Region used (for example, by importing a different preset into the object) to see that the script will work for any shape. You can also change the number of points in the PointGroup by adjusting the NumOfPoints variable in FreeForm script.

PointGroup filling SAA Region
Point Sensor From GroundStation
This Mission Plan demonstrates the use of FreeFlyer Script to point a Sensor from a site on the ground to an orbiting target. A ''placeholder'' Spacecraft is set at the GroundStation location so that a Vector can be drawn to or from that location. The Vector is converted to Spacecraft BCS and normalized, and then the Sensor pointing components are aligned to the Vector.

Sensor from Madrid pointing at TDRS Spacecraft
Point Sensor To GroundStation
This Mission Plan demonstrates the use of FreeFlyer Script to continuously align a Sensor to a GroundStation target. A ''container'' Spacecraft is placed at the GroundStation location so that a Vector can be drawn to that location. The Vector is converted to Spacecraft BCS and normalized, and then the Sensor pointing components are aligned to the Vector components.

Sensor from Spacecraft to GroundStation
Proximity Operations
This Mission Plan provides plots and visual outputs related to proximity operations with two spacecraft. This includes a plot of RIC separations between the two spacecraft, a plot of cross-track vs. along-track separations, a 3D view, and a sensor view from Spacecraft1 looking at Spacecraft2.

Plot of radial, in-track, and cross-track separations
Rectangular PointGroup
This Mission Plan demonstrates the use of FreeFlyer script to define a rectangular PointGroup, spread over the area of Colorado. You can change the min/max Lat/Long variables in the 'Set up PointGroup' FreeForm to create a custom rectangular PointGroup.

Rectangular PointGroup
Refraction Model Types
This Mission Plan demonstrates how to use the VisibilityCalculator object to use six different refraction models to determine when a GroundStation can see a Spacecraft during a seven hour propagation. Six VisibilitySegments are used to perform the same interval method calculation, each with a different refraction model. The available refraction models are:
•None •Numeric - Single Chapman Evaluation •Numeric - Multiple Chapman Evaluations •Analytic - Chapman •Analytic - TRORD •Numeric - Exponential |
Region
This Mission Plan demonstrates ability to study viewing of a region on the Earth by a spacecraft sensor. The region is defined by a series of points defined by geodetic Latitude and Longitude that are the vertices of the Region. A Region must include at least 4 points and must be a closed polygon, with the same values for the first and last points.
Use the ExclusionZone or InRegion methods to identify when a Spacecraft is over a region. Use the InView or Access methods to identify when a Spacecraft Sensor sees a region.
To learn more about topics related to this sample Mission Plan, see the Regions page of the Coverage and Contact Analysis Guide.

Plot of contact between a Spacecraft and a Region
Region - Apollo Landing Sites
This Mission Plan displays six landing sites on the Moon from the Apollo missions as Regions. A Region must include at least 4 points and must be a closed polygon, with the same values for the first and last points. If the Satellite's sub satellite point is in the landing site region, the landing site will turn white.
This Mission Plan uses the InRegion method to identify when the Spacecraft is over a Region. The six landings sites are represented by a List of Regions.

ViewWindow of a Satellite and the Apollo Landing Sites.
SAA
This Mission Plan displays three custom Region objects representing the South Atlantic Anomaly. As a LEO spacecraft passes in and out of the SAA, plots are created showing whether the spacecraft sub-satellite point is in one or more of the regions, and whether a sensor on the spacecraft is in view of the regions. The three SAA Regions are included in FreeFlyer as Object Presets. To learn more, see the Object Presets section of the Creating/Editing Objects page. Also see the ISS Over SAA Mission Plan above, which uses the Spacecraft.ParticleFlux and Spacecraft.ParticleFluxTimes to visualize the particle flux values due to the SAA.

2D Map of the South Atlantic Anomaly Object Presets
Sensor To Shooter
This Sensor-to-Shooter Mission Plan demonstrates the use of FreeFlyer to calculate response time, or the time required to uplink a location to be imaged to a constellation of five LEO spacecraft from a Command center, crosslink the location to all of the spacecraft, image the Target location with a minimum acceptable elevation, and download the imagery to a receiver on the USS Russell at another location on the earth (the “fighter in the field”).
Procedure:
1. Determine first SC in contact with the Command location and send request 2. Crosslink request to all SC 3. Determine first SC with request in view of Target1 location and take image 4. Crosslink image to all SC 5. Determine first SC with image in view of Receiver and downlink image |

Close-ups of target and receiver
To learn more about topics related to this sample Mission Plan, see the Sensors page of the Coverage and Contact Analysis guide.
SensorView
This Mission Plan demonstrates use of the polar plot capability of the PlotWindow Object. In this example, Spacecraft2 is viewed by a sensor on Spacecraft1, and several types of output are generated. There is a 3D ViewWindow showing the relative positions of the two spacecraft, a sensor-view ViewWindow showing the perspective of a sensor attached to Spacecraft1 pointing along the SC1 body x-axis, a Cartesian plot of the range between the two Spacecraft, and a polar plot of the azimuth and elevation from Spacecraft1 to Spacecraft2.

Polar Plot showing the relative direction from Spacecraft1 to Spacecraft2

3D View of Spacecraft
To learn more about topics related to this sample Mission Plan, see the Sensors page of the Coverage and Contact Analysis Guide.
Solar Power
This Mission Plan calculates solar power available from a solar array which is fixed to the body coordinate system (BCS) of a Spacecraft. You can view the effect of changing the Spacecraft attitude by choosing Fixed Attitude or Changing Attitude in the UserInterface. If you select changing attitude the Mission Plan demonstrates how to have FreeFlyer change the orientation of a 3U CubeSat during charging periods. Charging periods are defined as periods outside of shadow where no contact with desired GroundStation(s) is present. During these charging periods, FreeFlyer will slew the Spacecraft to maximize charging surface area. The Mission Plan generates .txt files for both shadow times and panel power throughout the duration of the propagation.
If you would like to examine other panel alignments instead of simply 'fixed to the Spacecraft BCS', you can set a new panel orientation in the 'Set solar panel orientation' FreeForm.

Plot of available power over time
Spacecraft Contact And Access
This Mission Plan demonstrates the ability to identify times when a sensor on one spacecraft can view another spacecraft. A report of viewing times is generated by means of the Access Interval Method. The Access method returns the start time, end time, and duration of a Spacecraft's Sensor's view of a Region, another Spacecraft, a GroundStation, or a celestial object. The Access time is based on any active Sensors of the Spacecraft.
A plot of the Contact property is generated. Contact is determined when any active Sensor of the argument Spacecraft is in view of the satellite. Contact returns a value of 1 when the argument is in contact, otherwise a value of 0.

3D View of two orbiting Spacecraft
Star
This Mission Plan models the star Alcyone (of the Pleiades) as the first element of a StarField object. Using Vectors and Coordinate Systems, a Spacecraft's attitude is set so that its BCS X-axis is pointed toward the star, so that a sensor located along that axis of the spacecraft will have a clear view.
Two plots are generated: one that shows the Spacecraft's resulting Euler Angles, and one that shows a series of flags indicating whether the star is occulted (hidden behind) the Earth, Moon, or Sun.
To learn more about topics related to this sample Mission Plan, see the Stars and Vectors and Coordinate Systems pages of the Interplanetary Analysis Guide.

3D View of Spacecraft1 viewing the star Alcyone and the Moon
In this Mission Plan, the International Space Station is shown as it orbits the Earth. Vectors are drawn from a Sensor on the ISS to the visible Groundstations. While the solar arrays rotate to point towards the Sun, the Vectors are tested to see if they intersect the rotating solar arrays. The Mission Plan pauses briefly to visually inspect any intersections.
To learn more about topics related to this sample Mission Plan, see Vehicle 3D Models in the Viewing Objects guide and Vectors and Coordinate Systems in the Interplanetary Analysis guide.

Vector intersecting the solar array.
Vector
This Mission Plan demonstrates the different ways to construct a Vector object in FreeFlyer. Each permutation of the different Vector types is shown in the four output windows.

Spacecraft-centered Vectors
VisibilityCalculator
This Mission Plan demonstrates how to use the VisibilityCalculator object to determine when one object can see another. The VisibilityCalculator allows you to determine visibility between Spacecraft, Sensors, GroundStations, CelestialObjects, and Stars. Each Segment of a VisibilityCalculator has options for controlling the occulting bodies, celestial object shape models, and refraction model (if any). In this example, three GroundStations are used as the observers, and a set of six GPS-like Spacecraft are set as the targets. The 18 possible segments are configured in the VisibilityCalculator and the visibility status is displayed using vectors in a 3D view as well as a GridWindow.

GridWindow indicating contact from GroundStations to GPS Spacecraft using a VisibilityCalculator