The GraphicsOverlay object in FreeFlyer allows you to display custom graphics on 2D or 3D output views. A GraphicsOverlay consists of one or more shapes, and each shape may contain multiple overlay elements. The following shape types are available:
•Lines •Annotations •Points •Triangles •Triangle Strips •Icons |
A single GraphicsOverlay object may contain multiple shapes of different types. A GraphicsOverlay is referenced to an object that is displayed in a ViewWindow, such as a Spacecraft or the Earth. If desired, WindowOverlay objects allow you to display content referenced to the bounds of the ViewWindow itself.
There are a variety of Sample Mission Plans (included with your FreeFlyer installation) that demonstrate various applications of these topics. Continue to the Generating Output page to view descriptions and images of these examples or jump to one of the Mission Plans listed below.
|
Creating a GraphicsOverlay
The GraphicsOverlay object can be created in the Object Browser, but can only be edited in FreeFlyer script. By default, a GraphicsOverlay's reference object is set to the Earth. The reference object is the FreeFlyer object to which the overlay geometry is referenced. An example of changing the reference object is shown below.
// Create Graphics Overlay GraphicsOverlay GraphicsOverlay1; GraphicsOverlay1.SetReferenceObject(Spacecraft1.ObjectId); |
The following properties control the location of the GraphicsOverlay as a whole. Note that specific locations for each element are referenced from the location given by these properties.
•Position - The offset position of the GraphicsOverlay with respect to the body fixed coordinate system of the ReferenceObject •Orientation - The quaternion orientation of the GraphicsOverlay with respect to the body fixed coordinate system of the ReferenceObject •Scale - The x, y, and z scaling factors of the GraphicsOverlay |
// Setting a custom offset for the location of the overlay GraphicsOverlay1.Position = {1000, 0, 500}; GraphicsOverlay1.Orientation = {0, 0.1, 0, 0.2}; GraphicsOverlay1.Scale = {0, 10, 0}; |
Note: The order of transformations is scaling, then rotation, and finally translation.
Adding Elements to a Shape
When a GraphicsOverlay is created, a default "Lines" shape type is created as the first shape. To add data points to the Line, use the AddOverlayElement method as shown below.
// Define line width GraphicsOverlay1.Shapes[0].SetLineWidth(0 /* Relative */, 1);
// Draw a line using two points GraphicsOverlay1.AddOverlayElement(x1, y1, 0); GraphicsOverlay1.AddOverlayElement(x2, y2, 0);
// Draw a line and specify a custom color GraphicsOverlay1.AddOverlayElement(x3, y3, 0, ColorTools.Aqua); GraphicsOverlay1.AddOverlayElement(x4, y4, 0, ColorTools.Red); |
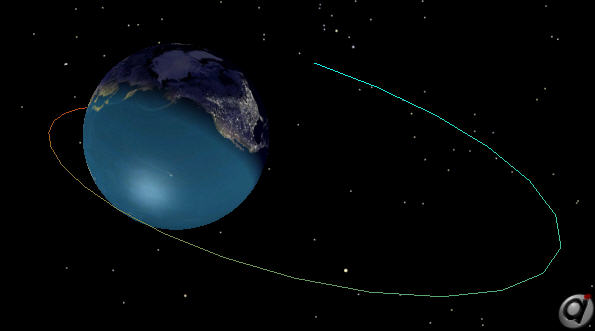
Graphics Overlay showing a line drawn in the Earth X-Y plane with fading colors
By default, the AddOverlayElement method expects you to specify data points as X, Y, Z values. However, you also have the option to input RA, Dec, Radius points. In this case you will add an additional "mode" argument to the beginning of the method call, as seen in the example below.
// Specify XYZ points GraphicsOverlay1.AddOverlayElement("x-y-z", x1, y1, z1); GraphicsOverlay1.AddOverlayElement("x-y-z", x2, y2, z2);
// Specify RA-Dec-Radius points GraphicsOverlay1.AddOverlayElement("ra-dec-radius", RA1, Dec1, Rad1); GraphicsOverlay1.AddOverlayElement("ra-dec-radius", RA2, Dec2, Rad2); |
This AddOverlayElement method is used to add data points to any of the GraphicsOverlay shape types, as seen in the example throughout this page.
Note: Care should be taken populating a large GraphicsOverlay shape when batch updating a ViewWindow using the ViewWindow.BeginBatchUpdate() and ViewWindow.EndBatchUpdate() methods. In this situation it is recommended that the ViewWindow be updated using a single Update command rather than updating after each overlay element is added to the GraphicsOverlay shape.
Adding Shapes to an Overlay
You can add additional shapes to a GraphicsOverlay using the AddShape method. There is also a RemoveShape method available for deleting shapes from an overlay. Every newly added shape will be a "Lines" shape type, but you can override a shape's type by setting the ShapeType property. The example below shows how to add a new shape using the AddShape method, change its type to Points, and add data points to the new shape.
// Draw a set of three points by specifying the x, y, z locations // Remember, these locations are referenced to the GraphicsOverlay's reference object. GraphicsOverlay1.AddShape(); GraphicsOverlay1.ShapeType = "Points"; GraphicsOverlay1.AddOverlayElement(x1, y1, z1); GraphicsOverlay1.AddOverlayElement(x2, y2, z2); GraphicsOverlay1.AddOverlayElement(x3, y3, z3); |
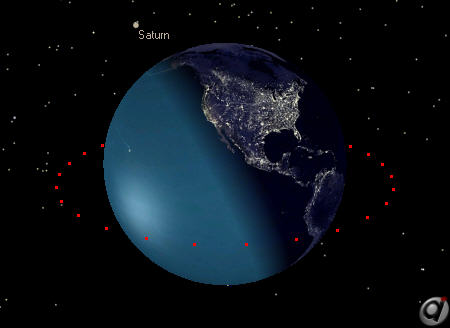
Graphics Overlay displaying a "Points" Shape
The NumberOfShapes property can be used to determine the number of shapes contained in a GraphicsOverlay.
Report GraphicsOverlay1.NumberOfShapes; |
Note: If you specify an annotation when adding an overlay element (ie, GraphicsOverlay1.AddOverlayElement(x, y, z, "annotation");), this will cause the shape type for the current shape to be set to "Annotations". Changing the shape type for any shape causes any previous configuration for that shape to be cleared.
Setting the Active Shape
Note that the AddOverlayElement method adds the data points to the currently active shape (in the example above, this was a "Points" shape). To edit properties of a previous shape, you can set the CurrentShapeIndex property to allow you to specify which shape you would like to edit.
// Set the Current Shape Index in order to access a previous shape in the overlay GraphicsOverlay1.CurrentShapeIndex = 0; |
The CurrentShapeIndex determines which shape is edited when you use a variety of the properties and methods available for the GraphicsOverlay. The properties and methods whose behavior depends on the CurrentShapeIndex include:
•Properties oShapeType - The shape type of the active shape oNumberOfVertices - The number of vertices in the currently active shape oVertices - The locations of the overlay points in the currently active shape oNumberOfAnnotations - The number of annotations in the currently active shape oAnnotationColors, AnnotationFont, AnnotationLabels, AnnotationLocations - The annotation properties of the currently active shape oShapeIconFilename - Specifies an image to draw at each vertex of the active shape oShapeOpacity - The opacity of the active shape oShapeOrientation - The quaternion orientation of the active shape oShapePosition - The offset position of the active shape oShapeScale - The x, y, and z scaling factors of the active shape oShapeTickType - Specifies which tick mark type to draw at each vertex of the active shape. Tick marks will be drawn for 'Lines', 'Annotations', 'Points', and 'Icons' shape types only. oShapeVisible - Determines whether the active shape is visible oShowTextBackDrop - Determines whether a translucent black rectangles is drawn behind annotations in the 2d map mode of the Mission View for the active shape •Methods oAddOverlayElement - Adds an element to the active shape of the GraphicsOverlay oClearOverlayElements - Clears all elements associated with the active shape of the GraphicsObject overlay |
Note: When working with the shape position, orientation, and scale properties, the order of shape transformations is scaling, then rotation, and finally translation.
Advanced Shape Types
While working with Lines, Points, and Annotations is fairly straightforward, allowing the user to simply specify the locations for each data point to be added, the options for some shapes are more complex.
Triangles
When working with the Triangles shape type, you have the ability to specify the vertices that define an unlimited number of triangles. Every group of three points that you add using the AddOverlayElement method will add a new triangle. The triangles will not be automatically connected in any way, unlike the Triangle Strip option discussed below.
This example shows how to create a Triangle shape in a GraphicsOverlay and add three triangles to the shape, each displayed in a different color as seen in the image below.
// Add a shape to the overlay which will contain a single blue triangle GraphicsOverlay1.AddShape(); GraphicsOverlay1.ShapeType = "Triangles";
// Add Overlay elements to the currently active shape
// This will draw Aqua, Fuchsia, and blue triangles on the equator
GO1.AddOverlayElement(1000, -Earth.RadiusEquatorial - 100 ,-1000); GO1.AddOverlayElement(1000, -Earth.RadiusEquatorial - 100, 1000); GO1.AddOverlayElement(-1000, -Earth.RadiusEquatorial - 100, 0, ColorTools.Aqua);
GO1.AddOverlayElement(-Earth.RadiusEquatorial - 100, 1000, -1000); GO1.AddOverlayElement(-Earth.RadiusEquatorial - 100, 1000, 1000); GO1.AddOverlayElement(-Earth.RadiusEquatorial - 100, -1000, 0,ColorTools.Fuchsia);
GO1.AddOverlayElement(1000, Earth.RadiusEquatorial + 100 ,-1000); GO1.AddOverlayElement(1000, Earth.RadiusEquatorial + 100, 1000); GO1.AddOverlayElement(-1000, Earth.RadiusEquatorial + 100, 0, ColorTools.Blue); |
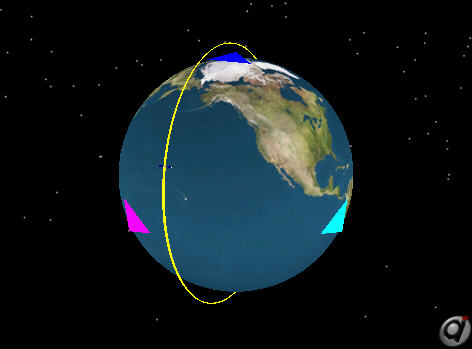
Graphics Overlay displaying a "Triangles" Shape
Triangle Strips
When working with Triangle Strips, again you have the ability to define the vertices for an unlimited number of triangles. The first three points that you set using the AddOverlayElement method will form the first triangle. Then, each additional point you specify will be used to create a new triangle that is formed using the three most recent points.
The image below illustrates this concept. The first three points form the first triangle: 123. The fourth point is added to form a second triangle: 234. As more points are added, new triangles are formed: 345, 456, 567, and so on.
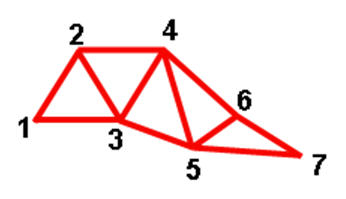
Image illustrating the concept of Triangle Strips
This functionality is very powerful and can be used to create many complex geometries. In the example below, we use basic trigonometric functions to create a triangle strip that forms a solid band, as shown in the image below.
// Create GraphicsOverlay referenced to a Spacecraft GraphicsOverlay GraphicsOverlay1; GraphicsOverlay1.SetReferenceObject(Spacecraft1.ObjectId);
// Set the shape type to Triangle Strip and make the strip green and slightly translucent GraphicsOverlay1.ShapeType = "Triangle Strip"; GraphicsOverlay1.DefaultColor = ColorTools.GreenYellow; GraphicsOverlay1.ShapeOpacity = 0.8;
For i = 0 to 100;
// Calculate 100 evenly-spaced angles spanning from 0 to 360 degrees angle = rad(360.0 * i/100.0);
x = cos(angle); y = sin(angle);
// Add overlay elements to the active shape // This will draw a ring around the spacecraft with a 1000 km radius // and a 200 km thickness
// X-Y plane triangle strip GraphicsOverlay1.AddOverlayElement(1000*x,1000*y,-100); GraphicsOverlay1.AddOverlayElement(1000*x,1000*y,100);
End; |
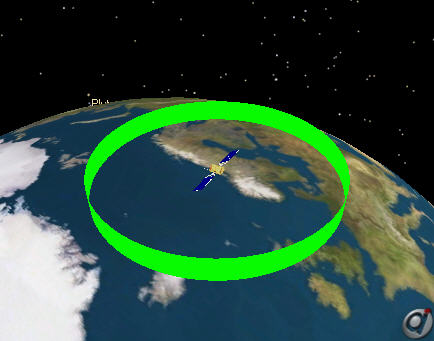
Green triangle strip surrounding a Spacecraft
If we modify the script to use a different color for every second triangle, the output image will show more clearly how the ring is formed:
//... // X-Y plane triangle strip GraphicsOverlay1.AddOverlayElement(1000*x,1000*y,-100, RGB(0,1,0)); GraphicsOverlay1.AddOverlayElement(1000*x,1000*y,100, RGB(.2,.8,.2)); //... |
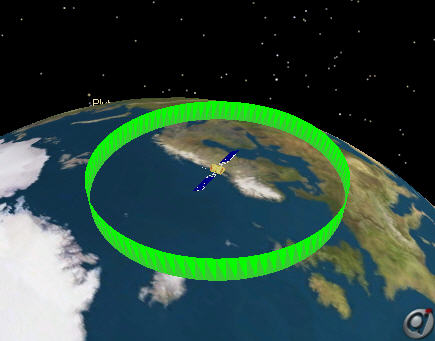
Two-tone green triangle strip surrounding a Spacecraft
Icons
The Icons shape type allows you to specify an image file to draw at each vertex specified using the AddOverlayShape method. The icon image will be drawn in 2D map views only. Supported image formats include PNG, TIF, JPG, BMP, and GIF. When working with Icons, you have access to a few additional properties and methods that only apply for this shape type:
•ShapeIconFilename - Specifies an image to draw at each vertex of the active shape •ShapeIconReferencePoint - Determines which point on the image will be located at the specified vertices. Valid values are: oCenter oUpper Left oLower Left oUpper Right oLower Right •ShapeIconRotation - The clockwise rotation of the icon about the ShapeIconReferencePoint in degrees •ShapeIconScale - A scale, specified in kilometers, determining how large the icon will be drawn on the 2d map oThe image will be drawn with a height proportional to the specified scale oThe width will be automatically selected as to maintain the original aspect ratio of the image oFor example, mapping a celestial object with a circumference of 2000 km and an icon scale of 500 km, the image will be drawn at half the height of the entire map when fully zoomed out oThe default value is 1000 |
The example below illustrates how to add a new shape to a GraphicsOverlay, set its type to "Icons", configure the icon file name, and display the icon at three separate locations on the 2D Map.
// Add a shape to the overlay which will contain an image from an external file GraphicsOverlay1.AddShape(); GraphicsOverlay1.ShapeType = "Icons";
// Set the file name and display options GraphicsOverlay1.ShapeIconFilename = "..\_Support_Files\ailogo.png"; GraphicsOverlay1.ShapeOpacity = 0.8; GraphicsOverlay1.ShapeIconScale = 2000;
// Add an Overlay element to the currently active shape // This will draw the same image at three locations on the equator GraphicsOverlay1.AddOverlayElement(Earth.RadiusEquatorial + 1000,0,0); GraphicsOverlay1.AddOverlayElement(0,Earth.RadiusEquatorial + 1000,0); GraphicsOverlay1.AddOverlayElement(0,-Earth.RadiusEquatorial - 1000,0); |
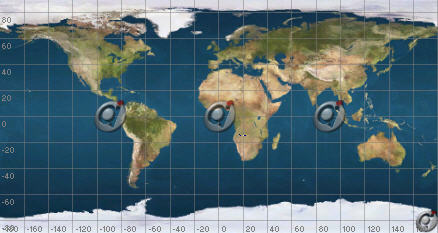
Graphics Overlay displaying an image file at three locations on the equator
Note: If you want to display images from multiple input files, you must create a new shape within the GraphicsOverlay for each file using the AddShape method.
See Also
•GraphicsOverlay Properties and Methods
•GraphicsOverlayShape Properties and Methods