The PlotWindow object displays graphical data in either a Cartesian or polar coordinate system, with monitor mode turned on or off.
•A PlotWindow can be used in place of a Plot, PolarPlot, Monitor, or PolarMonitor command. •To minimize system resources, plot data is thinned after a predefined number of data points are plotted. The default number of allowable data points is 2000; this can be configured through your User Preferences or in FreeForm Script. See the section on Data Culling and Batch Plotting for more information. •To minimize system resources, plots are only updated after a predefined number of data points have been collected into a buffer by either adding or removing the points. The default buffer size is 25 points; this can be configured through your User Preferences or in FreeFlyer script. See the section on Data Culling and Batch Plotting for more information. •For a complete list of available options, see the PlotWindow properties and methods page. |
Note: The PlotWindow object is not available to be generated on the Linux operating system through the runtime API or command line.
Create PlotWindows in FreeFlyer Script
PlotWindows can be created in FreeFlyer script. The following list displays a few of the features of the PlotWindow Object that are available in script.
•Ability to change all plot properties •Ability to customize plot styling •Ability to create lists of PlotWindows •Ability to dynamically add/remove data series from PlotWindows •Ability to plot polynomials based on coefficients •Ability to plot independent X/Y data series on the same Plot •Ability to plot entire datasets at once |
The following examples show how to create and edit PlotWindows in script.
Create a PlotWindow
The script example below shows how to create a PlotWindow via FreeFlyer script and customize its x- and y-axis labels.
PlotWindow PlotWindow1({Spacecraft1.ElapsedTime.ToHours(), Spacecraft1.A});
// --or--
PlotWindow PlotWindow1;
PlotWindow1.PlotType = "XYPlot"; PlotWindow1.XAxis.Title.Text = "Time in Hours"; PlotWindow1.YAxis.Title.Text = "Semi-major Axis in km"; PlotWindow1.ShowGridLines = 1;
Update PlotWindow1; |
Update a PlotWindow
When a PlotWindow is created with data series, the PlotWindow can be updated using the Update command at any point in the Mission Sequence.
PlotWindow PlotWindow1({Spacecraft1.ElapsedTime.ToHours(), Spacecraft1.A});
Update PlotWindow1; |
When a PlotWindow is created without attaching an data series, the user can add data series (or data points) at any time in the Mission Sequence and the PlotWindow will be updated.
PlotWindow PlotWindow1;
PlotScatterSeries SMA;
PlotWindow1.AddSeries(SMA);
SMA.AddPoints(Spacecraft1.ElapsedTime.ToHours(), Spacecraft1.A); // Updates PlotWindow1 |
Set PlotWindow Properties
The user can change all plot properties via FreeFlyer script. For example, the font type, color, size and text of the plot title and subtitle can be edited. There are options to customize the legend: show or hide the legend, set a legend title, choose the legend location, and show or hide the border. The x- and y-axis labels and formats can be set. The line type, color and other properties can also be set. The syntax example below displays a few of the these options.
// Set the Window Title PlotWindow1.WindowTitle = "Contact Plot";
// Set the Plot Title PlotWindow1.PlotTitle.Text = "Contact Between Spacecraft1 and GroundStation1"; PlotWindow1.PlotTitle.Color = ColorTools.Blue;
// Set the Legend Properties PlotWindow1.Legend.Location = 1; // Right of the Plot PlotWindow1.Legend.BorderVisible = 1; // Display Border
// Set XAxis and YAxis Properties PlotWindow1.XAxis.LabelsFont.Size = 8; PlotWindow1.XAxis.LabelsArrangement = 2; // Alternate rows PlotWindow1.YAxis.LabelsFormat = 'e'; // Scientific format
// Set the Line Properties PlotWindow1.LineType = 2; // Line and Points PlotWindow1.Series[0].MarkersColor = ColorTools.Red; PlotWindow1.Series[0].MarkersStyle = 8; // Small Dot |
Set Font Properties
As mentioned above, the user can set the font type for any of the string properties (title, subtitle, axis labels, etc.) on the PlotWindow Object. The syntax example below displays how to set the font type and style of the PlotTitle of PlotWindow1.
PlotWindow1.PlotTitle.Text = "Spacecraft In View"; PlotWindow1.PlotTitle.Font.Typeface = "Arial"; PlotWindow1.PlotTitle.Font.Bold = 1; // Font is Bold PlotWindow1.PlotTitle.Font.Italic = 1; // Font is Italic PlotWindow1.PlotTitle.Font.Underline = 1; // Underline Title |
If the user selects a font typeface (Arial, Times New Roman, Verdana, etc.) that is not available on their computer, FreeFlyer will revert to the previous font selected for the specified property. If the previous font is not available, FreeFlyer will use the default font typeface of the specified property. If the font typeface exists, but the style (combination of the bold, italic, underline, strikeout properties) is not available, FreeFlyer will try to select the closest match to the desired font typeface and style.
Axis Label Properties
You can set the format of the axis labels in FreeFlyer script or the PlotWindow Properties user interface. The formatting follows all of .NET's numeric and date/time format string options. The syntax to set the label format is shown below.
PlotWindow1.YAxis.LabelsFormat = '0.000'; |
The table below displays a few available options for setting the labels format and the associated output.
Label Format |
Example Output |
0 |
7 |
0.000 |
7.000 |
00e-0 |
20e-1 |
#.#x10E-# |
1.2x10E-1 |
#,##0.### |
1,250 |
The user can set the axis to use date and time formatting for the labels using the syntax below.
PlotWindow1.XAxis.UseDateTimeFormatting = 1; // True PlotWindow1.XAxis.LabelsFormat = "MMM dd yyyy HH:mm"; |
The default value of the UseDateTimeFormatting property is false, meaning that the axis content will not use the date and time format. When the axis content is an epoch, UseDateTimeFormatting is automatically turned on.
Note: It is important for the LabelsFormat property to correspond to the UseDateTimeFormatting flag. For example, if the user sets the LabelsFormat to use scientific notation ("e"), the UseDateTimeFormatting flag should be set to false (0) for the desired results.
Data Label Properties
You can turn on data labels and choose the label style for each plot scatter series in the plot as shown below. For example, the labels can display the point values, point indices, or custom string labels for each point.
PlotWindow1.ShowDataLabels = 1;
(PlotWindow1.Series[0] AsType PlotScatterSeries).DataLabelsBackgroundVisible = 1; (PlotWindow1.Series[0] AsType PlotScatterSeries).DataLabelsStyle = 2; // show custom labels
(PlotWindow1.Series[0] AsType PlotScatterSeries).DataLabels[0] = "custom point label"; |
PlotWindow Styling Methods
The user can change the styling of the output plot via FreeFlyer script. For example, the SeriesColorPalette, BackgroundColorPalette, LineWidth and text of the plot title and subtitle can be edited. The SeriesColorPalette is the color palette which will be used to stylize the series displayed in the specified PlotWindow. The BackgroundColorPalette is the color palette which will be used to stylize the plot displayed in the specified PlotWindow. The table below shows the options available for the PlotWindow.SetSeriesColorPalette() method.
Value |
Palette Colors |
Default Type |
"Accessible" |
|
Qualitative |
"Bright" |
|
Qualitative |
"Classic" |
|
Qualitative |
"Dark" |
|
Qualitative |
"Light" |
|
Qualitative |
"Paired" |
|
Qualitative |
"Pastel" |
|
Qualitative |
"Blues" |
|
Sequential |
"CubeHelix" |
|
Sequential |
"Grays" |
|
Sequential |
"Greens" |
|
Sequential |
"Purples" |
|
Sequential |
"Reds" |
|
Sequential |
"Spectral" |
|
Sequential |
"BluePurpleYellow" |
|
Diverging |
"GreenYellowRed" |
|
Diverging |
"PurpleBlueGreen" |
|
Diverging |
"YellowRedPurple" |
|
Diverging |
The syntax example below displays a few of the Plot styling methods available in FreeFlyer scripting.
PlotWindow PlotWindow1;
PlotScatterSeries X; PlotScatterSeries Y; PlotScatterSeries Z;
PlotWindow1.AddSeries(X); PlotWindow1.AddSeries(Y); PlotWindow1.AddSeries(Z);
// Set Series Color and Background Color PlotWindow1.SetSeriesColorPalette("Pastel"); PlotWindow1.SetBackgroundColorPalette("DarkGray");
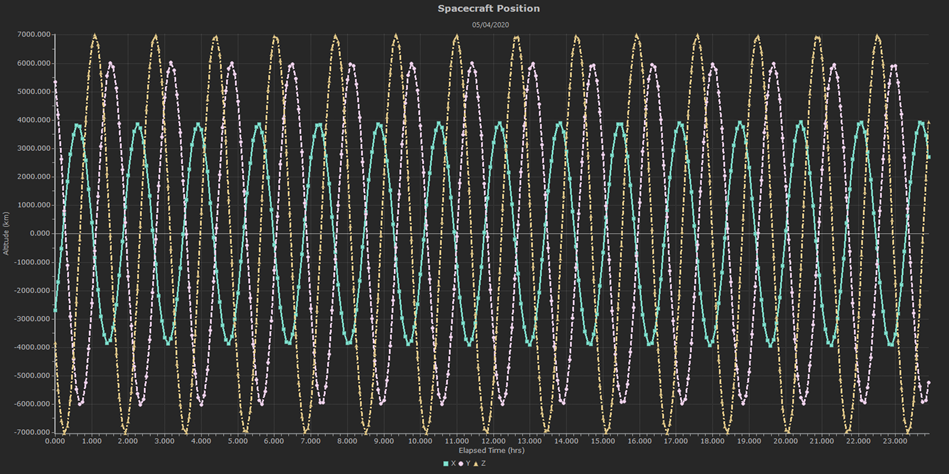
// Set the Plot Titles PlotWindow1.PlotTitle.Text = "Spacecraft Position"; PlotWindow1.SetAxisTitles("Elapsed Time (hrs)","Altitude (km)");
// Set Marker Size and Line Width PlotWindow1.SetLineWidth(3); PlotWindow1.SetLineVisibility(1); PlotWindow1.SetMarkerSize(2); PlotWindow1.SetMarkerVisibility(1);
While(Spacecraft1.ElapsedTime < TimeSpan.FromDays(2)); Step Spacecraft1; X.AddPoints(Spacecraft1.ElapsedTime.ToHours(), Spacecraft1.X); // Updates PlotWindow1 Y.AddPoints(Spacecraft1.ElapsedTime.ToHours(), Spacecraft1.Y); // Updates PlotWindow1 Z.AddPoints(Spacecraft1.ElapsedTime.ToHours(), Spacecraft1.Z); // Updates PlotWindow1 End; |
Output:
Hide Data from a PlotWindow
You can hide data from a PlotWindow by adding or removing data points. This can be used to display only the most important data at different times, or to color-code the data during an event. See the Sample Mission Plan PlotWindow - Scatter Series to see a complete example.
Export the PlotWindow
The data and image of the PlotWindow can be saved via FreeFlyer script. The high quality rendering option smooths the image so that the plot appears less pixelated.
PlotWindow1.HighQualityRendering = 1; PlotWindow1.SavePlotData("TXT","PlotWindow1_Data.txt"); PlotWindow1.SavePlotImage("PNG","PlotWindow1.png"); |
Using the Assign (=) Operator
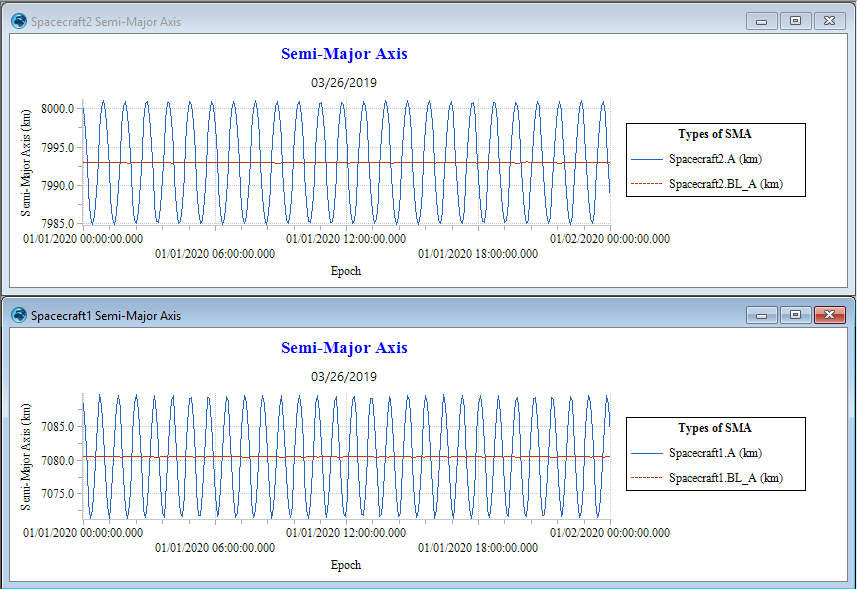
You can assign Series, Font, Title, Axis, and Legend Objects equal to other Objects of the same type using the assign (=) operator. This works differently than how the assign (=) operator works with Spacecraft or GroundStation Objects. With plot-related objects, assignment of two objects will assign the properties of all their child objects as well. For example, for a Plot Axis, its child Font and Title objects will be assigned (as well as the Font of the Title child object). See the syntax example and output below.
This lets the user easily configure multiple plots to have a consistent look and feel.
PlotWindow PlotWindow1({Spacecraft1.EpochText, Spacecraft1.A, Spacecraft1.BL_A});
PlotWindow1.WindowTitle = 'Spacecraft1 Semi-Major Axis';
// Set the PlotTitle Properties PlotWindow1.PlotTitle.Text = 'Semi-Major Axis'; PlotWindow1.PlotTitle.Font.Typeface = "Times New Roman"; PlotWindow1.PlotTitle.Color = ColorTools.Blue;
// Set the XAxis Properties PlotWindow1.XAxis.LabelsArrangement = 2; PlotWindow1.XAxis.LabelsFont.Typeface = "Times New Roman"; PlotWindow1.XAxis.Title.Font.Typeface = "Times New Roman"; PlotWindow1.XAxis.Title.Text = 'Epoch';
// Set the YAxis Properties PlotWindow1.YAxis.LabelsFont.Typeface = "Times New Roman"; PlotWindow1.YAxis.Title.Font.Typeface = "Times New Roman"; PlotWindow1.YAxis.LabelsFormat = "0.0"; PlotWindow1.YAxis.Title.Text = 'Semi-Major Axis (km)';
// Set the Legend Properties PlotWindow1.Legend.BorderVisible = 1; PlotWindow1.Legend.Location = 1; // Right PlotWindow1.Legend.Font.Typeface = "Times New Roman"; PlotWindow1.Legend.Title.Text = 'Types of SMA'; PlotWindow1.Legend.Title.Font.Typeface = "Times New Roman"; PlotWindow1.Legend.Title.Font.Bold = 1;
PlotWindow PlotWindow2({Spacecraft2.EpochText, Spacecraft2.A, Spacecraft2.BL_A});
// Assign properties of PlotWindow2 = PlotWindow1 PlotWindow2.WindowTitle = 'Spacecraft2 Semi-Major Axis'; PlotWindow2.PlotTitle = PlotWindow1.PlotTitle; PlotWindow2.XAxis = PlotWindow1.XAxis; PlotWindow2.YAxis = PlotWindow1.YAxis; PlotWindow2.Legend = PlotWindow1.Legend; |
Output:
Note: A PlotSeries object can only be added to single PlotWindow. If you want to add the same PlotSeries object to a second PlotWindow object, you should use the Assign operator to create a second copy of the series.
PlotWindow Object Editor
You can also create a PlotWindow in the Object Browser.
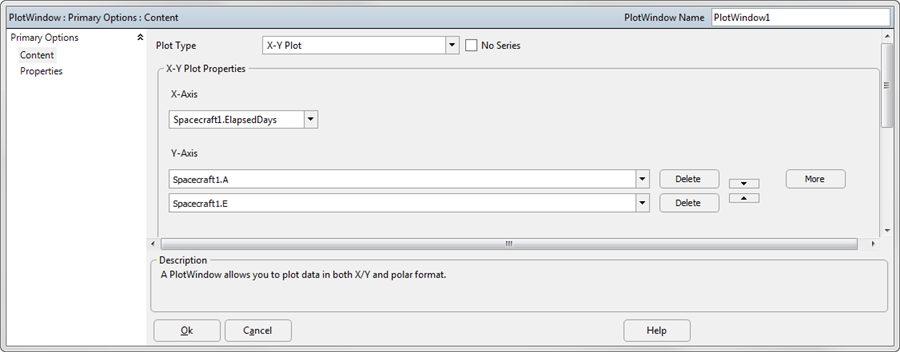
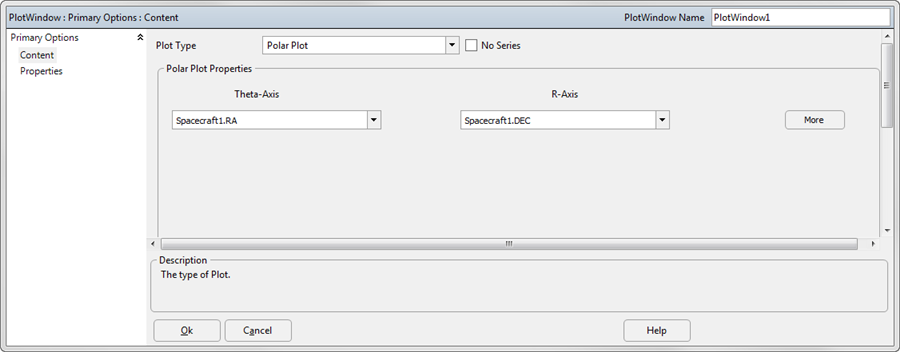
The Content page allows users to configure the type of plot to generate (Cartesian or polar, as seen in the images below) and specify the data to show on each axis.
•X-Y Plot
•Polar Plot
|
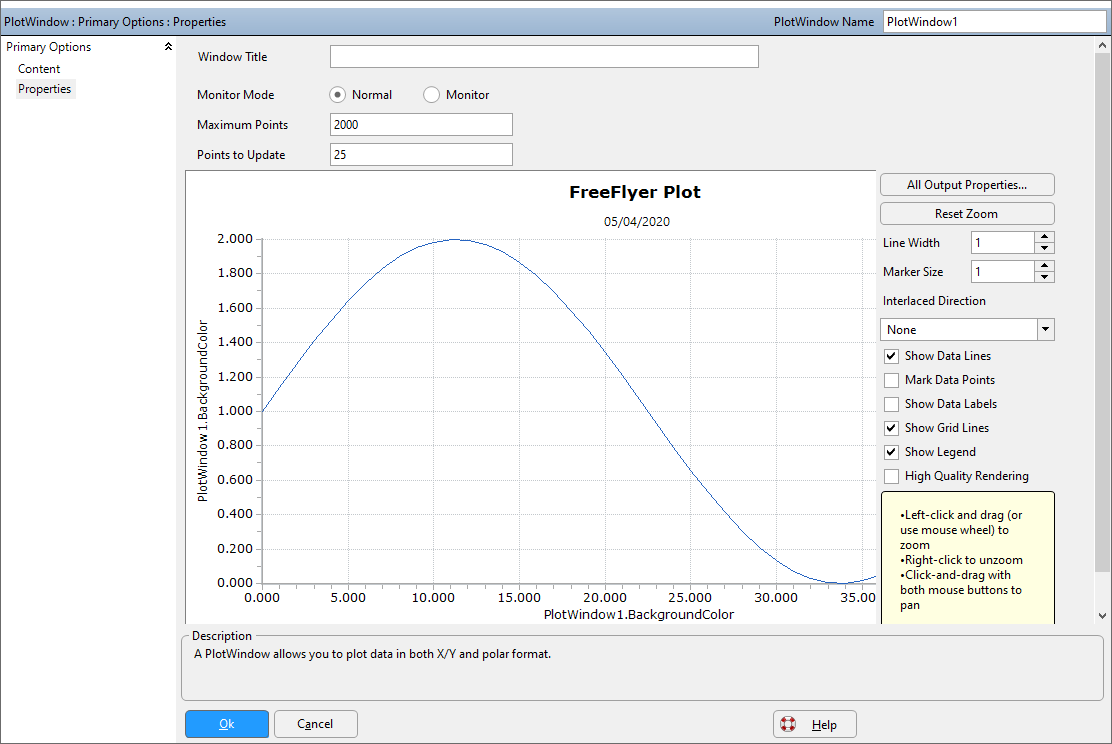
The Properties page of the PlotWindow object editor allows the user to configure custom titles and axis labels, using custom fonts and text styles, and set the maximum points and points to update properties. The "All Output Properties" button allows the user to edit any of the Plot Properties, as described in the section below. Users can also enable monitor mode, select whether to show lines, points, data labels, and/or grid lines.
Note: For Mission Plans still using millisecond precision mode, the Properties page also lets you define the Update Mode of the ViewWindow. As of FreeFlyer 7.3, the default timing precision mode is nanosecond precision mode; which provides more modern and robust interfaces for this functionality. See Object vs. Command Output for more information on the Update Mode and Target Display Mode.
PlotWindow Output Properties
Available from both the PlotWindow object dialog and the Output Properties tab within the workspace, the Plot Output Properties panel gives access to every property that can affect the display of the PlotWindow. All of these properties are configurable through FreeFlyer scripting as well. The following list describes the areas of the PlotWindow that can be edited by the Plot Output Properties window.
•Chart Properties oTitles and Legend oAxes ▪X-Axis ▪Y-Axis oChart Area •Series Properties oEach Added Series |

Plot Properties Panel
Note: Using the replay toolbar after the Mission Plan has completed execution will not affect the contents of a PlotWindow.
See Also
•Plot Command
•Monitor Command
•PolarPlot Command
•PolarMonitor Command
•Update Command
•PlotWindow Properties and Methods