A PlotSeries object can be added to a PlotWindow. There are two types of PlotSeries available in FreeFlyer:
•PlotScatterSeries - Series is defined by X/Y data •PlotPolynomialSeries - Series is defined by a polynomial equation |
The user can add or remove data points from a PlotScatterSeries, or set the coefficients of a PlotPolynomialSeries, at any time during a Mission Plan. The PlotSeries object can also be added or removed from a PlotWindow at any time. You can also display a label at any point in a PlotScatterSeries, displaying either the point value or a custom point label.
Note: A PlotSeries object can only be added to single PlotWindow. If you want to add the same PlotSeries object to a second PlotWindow object, you should use the Assign operator to create a second copy of the series.
Plot Scatter Series
The script example below shows how to plot X/Y data representing a sine wave.
Variable x; Variable y;
PlotWindow PW; PlotScatterSeries sinData;
PW.AddSeries(sinData);
For x = 0 to 10 step .1;
y = sin(x);
sinData.AddPoints(x,y);
End; |
This snippet shows an example of how to display custom data labels at each point in a scatter series. You can specify labels when you add points to the plot using the PlotScatterSeries.AddPoints() method, as shown here, or you can specify a label for individual points through the PlotScatterSeries.DataLabels array property.
Array x = {0, 5, 10}; Array y = {1, 3, 9}; StringArray labels = {"start", "midpoint", "end"};
PlotWindow PW; PlotScatterSeries series1;
PW.AddSeries(series1);
// Configure the display of the series markers and labels series1.MarkersVisible = 1; series1.DataLabelsVisible = 1; series1.DataLabelsBackgroundVisible = 1; series1.DataLabelsStyle = 2;
// Add points with custom labels series1.AddPoints(x, y, labels); |
Plot Polynomial Series
The script example below shows how to plot a polynomial series representing a cubic function.
PlotWindow PW; PlotPolynomialSeries x3data;
x3data.SetCoefficients({1,-2,3,4});
PW.AddSeries(x3data); PW.Series[0].Label = "y = x^3 - 2x^2 + 3x + 4";
PW.XAxis.SetRange(-5,5); PW.YAxis.SetRange(-10,10);
Update PW; |
Note: Since the polynomial series can have an infinite number of points, the "Marker" properties cannot be set.
Add or Remove Points
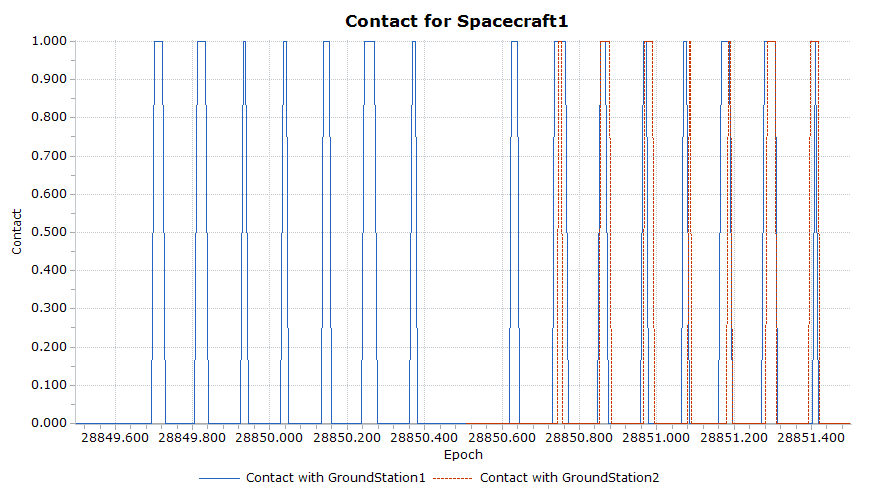
The example below creates a plot showing the contact between a Spacecraft Object and two GroundStation Objects. The script adds points to the first PlotScatterSeries, ContactGroundStation1, for the entire Propagation. After one day, data is also added to the second PlotScatterSeries, ContactGroundStation2.
// Create PlotWindow Object PlotWindow PlotWindow1; PlotWindow1.PlotTitle.Text = 'Contact for Spacecraft1'; PlotWindow1.PlotSubTitle.Text = ''; PlotWindow1.YAxis.Title.Text = 'Contact'; PlotWindow1.XAxis.Title.Text = 'Epoch';
// Create PlotScatterSeries Objects PlotScatterSeries ContactGroundStation1; PlotScatterSeries ContactGroundStation2; ContactGroundStation1.Label = 'Contact with GroundStation1'; ContactGroundStation2.Label = 'Contact with GroundStation2'; PlotWindow1.AddSeries(ContactGroundStation1); PlotWindow1.AddSeries(ContactGroundStation2);
ContactGroundStation1.AddPoints(Spacecraft1.Epoch, Spacecraft1.Contact(GroundStation1));
// Propagation Loop While (Spacecraft1.ElapsedTime.ToDays() < 2);
Step Spacecraft1;
ContactGroundStation1.AddPoints(Spacecraft1.Epoch, Spacecraft1.Contact(GroundStation1));
If (Spacecraft1.ElapsedTime.ToDays() > 1); // After 1 day, GroundStation2 is available ContactGroundStation2.AddPoints(Spacecraft1.Epoch, Spacecraft1.Contact(GroundStation2)); End;
Update PlotWindow1;
End; |
Output:

Contact between Spacecraft1 and two GroundStation Objects
See Also
•PlotWindow Object Properties and Methods
•PlotScatterSeries Properties and Methods
•PlotPolynomialSeries Properties and Methods