Description
The PolarPlot command creates a plot of two or more user-specified object properties, displaying all available values. The data points are specified using angle and radius (ө, r) pairs. For example, this can be used to view ground station passes by satellites (Azimuth and Range data) or geosynchronous satellite control (RAAN and Inclination data). For more information, see the Generating Output Guide.
Syntax
PolarPlot myAngle, myRadius; |
Where myAngle and myRadius evaluate to numbers
Details
•An unlimited number angle/radius pairs can be plotted.
•The total number of plotted values must be even.
•Angle values are applied in degrees.
•The PolarMonitor command provides the same functionality as the PolarPlot command, but automatically erases older data points so that only the most recent data is shown.
•To minimize system resources, plot data is thinned after a predefined number of data points are plotted. The default number of allowable data points is 500; this can be configured through FreeFlyer's Options Menu à Preferences à User Preferences à Plot Properties page.
•To minimize system resources, plots are only updated after a predefined number of data points have been collected into a buffer. The default buffer size is 25 points; this can be configured through FreeFlyer's Options Menu à Preferences à User Preferences à Plot Properties page.
•You can hide certain series from plots by setting the value to -999. This can be used to display only the most important data at different times, or to color-code the data during an event.
•A PlotWindow object can be used in place of a PolarPlot command.
oPlotWindows can display graphical data in either a Cartesian or polar coordinate system, with monitor mode turned on or off.
oPlotWindows can be updated using the Update command at any point in the Mission Sequence or they can be updated automatically every time a Spacecraft is stepped or maneuvered.
•In millisecond timing precision mode only, the deprecated "as Global" syntax can be used to update the plot when any spacecraft is Stepped or Maneuvered.
oNote that the "as Global" option is scoped to the control statement it was called in. That is to say, when the "as Global" option is used inside of an If block, While loop, or For loop, all steps inside of the control statement will automatically be displayed; any steps taken outside of the control statement will NOT be displayed.
PolarPlot mySpacecraft.RA, mySpacecraft.DEC as Global; |

Example Polar Plot Output
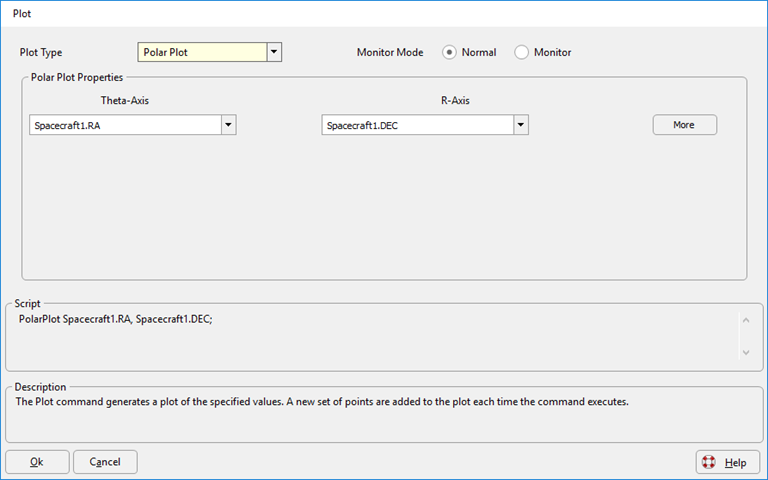
Command Editor
Note: The Plot, PolarPlot, Monitor, and PolarMonitor command editors are all accessed by adding a Plot command editor to the Mission Sequence.
Plot Type
•X-Y Plot •Polar Plot |
Monitor Mode
•Normal oAll available values are displayed •Monitor oThe plot will begin erasing the oldest data points once the number of points reaches or exceeds the maximum points setting for the plot, so that it will only display the most recent data |
Polar Plot Properties
•Defines the theta- and r-axes of the plot •Use the More button to add additional series to the plot |
Script
•Displays the FreeFlyer Script that is generated by the editor |
Description
•Displays descriptions of the editor and its fields •Description text changes as the mouse pointer moves over the different fields within the editor |
See Also
•Plot Command
•Monitor Command
•PolarMonitor Command
•Generating Output Guide