The Demos folder contains the Mission Plans that are displayed on the FreeFlyer Home Screen under the Demonstration Mission Plans block, as seen below. The available Mission Plans vary based on the Edition of FreeFlyer you are working with: Engineer or Mission. These Mission Plans have been developed to showcase FreeFlyer's visual and computational capabilities.
Jump to a Mission Plan Description:
Mission Plan |
Engineer |
Mission |
• |
• |
|
|
• |
|
• |
• |
|
• |
• |
|
• |
• |
|
• |
• |
|
• |
• |
|
• |
• |
|
• |
• |
|
• |
• |
|
|
• |
|
|
• |
|
• |
• |
|
• |
• |
|
• |
• |
|
• |
• |
|
• |
• |
|
• |
• |
|
• |
• |
|
• |
• |
|
• |
• |
|
• |
• |
Battlespace Communications
The Battlespace Communications Mission Plan demonstrates the use of FreeFlyer to provide a coverage analysis for battlefield scenarios. This scenario presents one spacecraft in a LEO orbit, another in a Polar orbit, and yet another in a Geostationary orbit. Groundstations are set up at Kwajalein, Madrid, and Vandenberg, while a command center is setup in Baghdad. FreeFlyer produces Contact start and end times between both the LEO and Polar spacecraft and the groundstations. Pass Data reports are generated for all three spacecraft and sent to output files.

3D Overview of the Battlespace scenario
Close Approach Maneuver
This Mission Plan demonstrates FreeFlyer's ability to parse a Conjunction Data Message (CDM), in JSON or KVN format, to calculate the Time of Closest Approach (TCA) and Probability of Collision (Pc) for a conjunction of two spacecraft in Low Earth Orbit (LEO). Then it is used to plan a Risk Mitigation Maneuver (RMM) to reduce the Pc value to 0 for the calculated TCA and plots the required maneuver size and resulting range at TCA.

View of Close Approach at TCA
Constellation Coverage
This Mission Plan demonstrates how FreeFlyer can be used to dynamically create a constellation of spacecraft and subsequently perform coverage analyses using the created constellation. The constellation is built by the user selecting custom orbital elements, a pre-built constellation, or by inputting a TLE set.

Example of the output from the ConstellationCoverage.MissionPlan.
Debris Field Visualization
This Mission Plan demonstrates the use of FreeFlyer to visualize the dispersion of the Fengyun1C, Cosmos, and Iridium debris fields and the orbits of the International Space Station (ISS) and an Earth Observation Satellite (Aura).

View of the Fengyun, Cosmos, and Iridium debris on Nov 04, 2013
Earth-to-Moon Analysis
This analysis demonstrates the use of FreeFlyer to calculate the delta-V costs of transferring a Spacecraft from low-Earth orbit to a lunar mapping orbit. Five different transfer orbit cases are considered.
Each case uses a three stage targeting process:
1.Target the RAAN and Argument of Perigee of the initial parking orbit to achieve a particular B-plane 2.Target the delta-V required at the first periselene for lunar capture 3.Target the delta-V required at the second periselene for insertion into lunar mapping orbit |

Three transfer cases for an Earth-to-Moon trajectory
GPS Operation
This Mission Plan demonstrates the use of FreeFlyer for visualizing the launch and orbit insertion of a GPS satellite. The mission phases are outlined as:
•Coarse Spin Precession Maneuver (CSPM) •Apogee Kick Motor (AKM) •Despin #1 •Despin #2 •Earth Acquisition |

Overview of a GPS satellite Launch and Orbit Insertion
Interplanetary Constellation
This Mission Plan demonstrates how FreeFlyer can be used to dynamically create a constellation of spacecraft around different central bodies and subsequently perform coverage analysis using the created constellation. The constellation is built by the user selecting custom orbital elements. Once the constellation, or "Formation", has been created, it is visualized in 2D and 3D ViewWindow and propagated for a user specified number of days. During the propagation period, a coverage analysis is conducted. This analysis makes use of the PointGroup object's built-in Coverage method. Depending on how many times a point has been seen, it will be color-coded accordingly.

3D View of Constellation around a non-Earth Central Body
Interstellar Asteroid
This Mission Plan loads in the orbital data for an interesting interstellar asteroid from a SPICE file, and then propagates the asteroid alongside its planetary neighbors to visualize its orbit. The asteroid, 2015 BZ509, is an asteroid in a resonant, retrograde orbit that is co-orbital with Jupiter. It is thought to be the first example of an interstellar asteroid that has been captured in the Solar System, and it flies through both of Jupiter's captured asteroid collections at the L4 and L5 Lagrange points of the Jupiter-Sun celestial system. To help visualize the orbit, both a standard 3D Viewpoint and a Rotating Pulsating (RP) Viewpoint are used. The RP view allows you to see the Jupiter-Sun celestial system and how the asteroid intersects it, while the 3D view enables you to easily see the asteroid's orbit relative to the Ecliptic plane.

Sun-Jupiter Rotating View of 2015 BZ509
ISS Visualization
In this International Space Station (ISS) demonstration, FreeFlyer displays a 3D visual of the ISS as it orbits the Earth. As a part of this visualization, the solar arrays are shown tracking the Sun, and arrows representing the ISS velocity vector and sun vector are drawn.

Close-up of the International Space Station
This Mission Plan demonstrates the flight dynamics modeling for the James Webb Space Telescope (JWST) including necessary station keeping maneuvers to maintain a halo orbit around L2, and how JWST can rotate to look at various stars. A 3D model is used to visualize JWST and the NIRCam & MIRI instruments onboard JWST are modeled as sensors. These are shown on a star map along with the Sun Exclusion Zone; an area within which the instruments cannot point during JWST's mission.

Close up of the James Webb Space Telescope
KalmanFilterOD - Lunar TDRS Relay
This Mission Plan demonstrates FreeFlyer's ability to process 4-leg TDRS relay observations using Ground Stations on both the Earth and Moon. Two-way Range and Doppler measurements are simulated and filtered for the DSN stations and a Lunar Base located near the Moon's north pole. This Mission Plan uses external script files, known as Procedures and Macros, to execute generalized sections of FreeFlyer script. The Call command is used to execute the desired Procedure or Macro.

View of Lunar Spacecraft being estimated using TDRS relay.
KalmanFilterOD - Pseudorange Point Solution Comparison
This Mission Plan demonstrates the use of the FreeFlyer Orbit Determination system to process Pseudorange and PointSolution tracking data. Both data types are processed in the same Kalman Filter. The orbit separations between the pseudorange and point solution results are plotted and visualized in a close-up 3D view. The wide view shows the GPS constellation and the low Earth orbit of the spacecraft being estimated. Yellow vectors which indicate which GPS satellites are generating pseudorange observation data.

View of LEO Spacecraft being estimated using GPS Pseudorange data
Lunar Gateway
This Mission Plan visualizes the lunar-orbit Gateway, a planned crew-tended outpost at the Moon that will serve as a short-term habitation module, science laboratory, and more. The Gateway will be a proving ground for deep space technology and a staging location for human missions to the lunar surface and beyond the Earth-Moon system. This Mission Plan demonstrates a variety of visualization options, including a rotating view based on the Earth-Moon RotatingLibrationPoint L2, as well as illustrating FreeFlyer's interplanetary capabilities. The Gateway Spacecraft is propagated using an ephemeris.
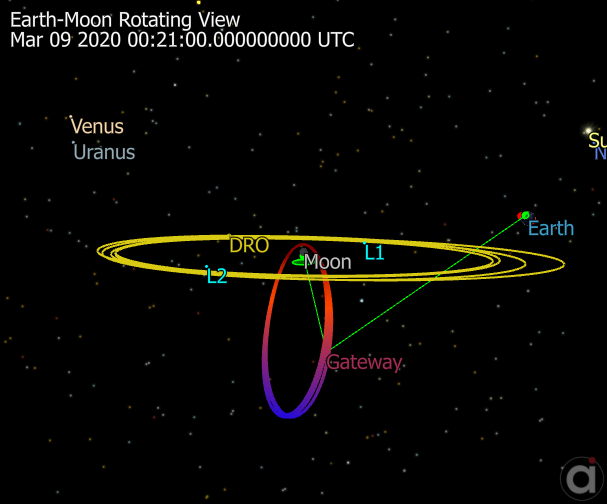
Rotating view of Gateway in lunar near-rectilinear halo orbit (NRHO)
MMS Visualization
This Mission Plan visualizes the NASA Magnetospheric Multiscale (MMS) Mission. Used for FreeFlyer demos, this Mission Plan shows the user many good tips and tricks for making the most out of FreeFlyer's visualization capabilities. GraphicsOverlay objects illustrate Earth's magnetic field, formation quality, and formation labeling. Also demonstrated is the capability to pan and rotate, necessary for many visualization solutions.

Magnetospheric Multiscale Mission spacecraft in formation
Natural Motion Circumnavigation
This Mission Plan demonstrates a possible maneuver sequence to place a co-planar, near-neighbor chaser satellite ("Deputy") into a natural circumnavigation arrangement with a geosynchronous target satellite ("Chief"). The circumnavigation injection maneuver components are calculated using FreeFlyer's built-in relative motion utility.
A custom UserInterface is used to configure the simulation. Configurable parameters include the Chief satellite's geosynchronous orbit, the initial offset between the Chief and Deputy in km, and the desired minimum standoff range between the Chief and Deputy during circumnavigation.

View of Deputy's Relative Motion Orbit
NRHO Energy Visualization
This Mission Plan demonstrates the use of the GraphicsOverlay object to visualize the magnitude of orbital energy as a function of semi-major axis for Moon-centric orbits. Orbital energy is defined as -Mu/2a. The specific energy of LLO (Low Lunar Orbit) and NRHO (Near-Rectilinear Halo Orbit, the planned trajectory for NASA’s Gateway) are plotted within the energy well.

3D view and plot of the NRHO's specific orbital energy
OpticalLink Moon GroundStation
This Mission Plan models a direct optical communication link between a ground station on the Moon and one on Earth using FreeFlyer’s OpticalLink object. It analyzes and compares the performance of multiple modulation schemes, specifically 8-PPM, 32-PPM, 64-PPM, and OOK-NRZ across a 12-day window. The analysis includes:
o Bit rate estimates for each scheme given a fixed bit error rate (BER)
o Transmitter power requirements per modulation
o Computed signal-to-noise ratio (SNR) and receiver sensitivity
o Impact of changing atmospheric visibility and elevation angle
o Visualization of beam divergence vs. transmitter gain
o Meteorological visibility fluctuations based on time and geometry
It demonstrates how the OpticalLink.ComputeBitRateForSNR() method can be used to dynamically assess achievable throughput as a function of link geometry, modulation type, and signal power under time-varying visibility conditions.

3D view and plots of estimated bit rate and meteorological visibility
RFLink
This Mission Plan demonstrates how to visually model an antenna's gain using an imported antenna pattern file and plots the downlink power, downlink carrier-to-noise ratio, and the link margin between the transmitter and receiver over time using the RFLink object. The RFLink object also has the ability to determine the Spacecraft gain from an antenna gain pattern or by estimating using the effective isotropically radiated power (EIRP). You are able to visualize antenna models represented by antenna pattern files in the supported formats:
•Phi Theta •Theta Phi |

Antenna Gain Visualization and plots of the Power, Carrier to Noise ratio, and Free Space Path Loss
Satellite Breakup Simulation
This analysis demonstrates the use of FreeFlyer to examine the distribution of the debris field following a destructive satellite breakup while on orbit. The debris field being analyzed is generated by applying randomly calculated delta-v's to the initial seed state. For this analysis, 4000 particles are used. The debris field is propagated for a few orbits to visualize the dispersion of the resulting debris over the plane of the orbit. Higher energy particles are colored in red, while lower energy particles are colored blue.

Dispersion of orbital debris
SBSS Search
This Mission Plan shows three potential SBSS spacecraft, in the same orbit plane separated by 120 in anomaly. Five target spacecraft are also shown: three in GEO orbit, two in Walker formation. The demonstration starts by showing one of the SBSS spacecraft and its sensor, which sweeps along the GEO plane looking for targets reflecting sunlight. The sensors always look in the direction opposite to the Sun for the best chance of catching reflections. Targets that are 'reflecting' are shown in yellow; the others are colored black. SBSS will sweep and search for targets that are reflecting and not currently being tracked by other SBSS. Sensors in sweep mode have a half-angle of 45°; the beams narrow when locked onto a target. Views down sensor boresights are shown.
The SBSS are in Sun Sync orbit, always illuminated by the Sun, maximizing look-time toward anti-Sun GEO.

Overview of SBSS Search scenario
Slew Maneuver
This Mission Plan includes a Procedure that slews a Spacecraft's attitude to look along a specified CoordinateSystem, and this is leveraged in a way that shows an imaging Spacecraft looking at different cities in the United States of America.
In order to visualize and report the slewing information, this Mission Plan propagates a Spacecraft with an attached Sensor in LEO, determines which city of interest is the closest in range to the Spacecraft, and then leverages the SlewSpacecraft Procedure to orient the satellite at a reasonable slewing rate towards that city. A Struct is used to communicate the official name of the city forward through the propagation to ultimately be reported to the Console when the Spacecraft initially begins slewing. Meanwhile, a GraphicsOverlay draws out the actual path of the Spacecraft's slewed Sensor upon the surface of the Earth.

3D ViewWindow display of the imagine Spacecraft slewing towards a target GroundStation
Swarm Formation
This Mission Plan demonstrates a Swarm Formation that has reached its insertion orbit. The Primary satellite will begin orbit raising to achieve the optimal formation for the three satellites. The quality tracker is used to track the Swarm formation, where a value below 0.5 is failing the required formation, a value between 0.5 – 0.75 is getting closer to the ideal formation, and a value greater than 0.75 means the ideal formation is achieved.

3D ViewWindow display of the Swarm Formation