The Tracking Data Editor object can be used to view the tracking data contained in an external file. FreeFlyer presents the data in a graphical format and allows you to choose whether to view the measurements directly or view the residuals. This page discusses the following items:
There are a variety of Sample Mission Plans (included with your FreeFlyer installation) that demonstrate various applications of these topics. Continue to the Orbit Determination Samples page to view descriptions and images of these examples or jump to one of the Mission Plans listed below.
|
Configuring the Tracking Data Editor
The user can configure a TrackingDataEditor object in the Object Browser or in FreeFlyer script. This section covers the following topics:
•Configuring the Tracking Data Editor •Data Segmentation Method •Default Data Type •Default Measurement Types •Data Scaling Modes |
Configuring the Tracking Data Editor
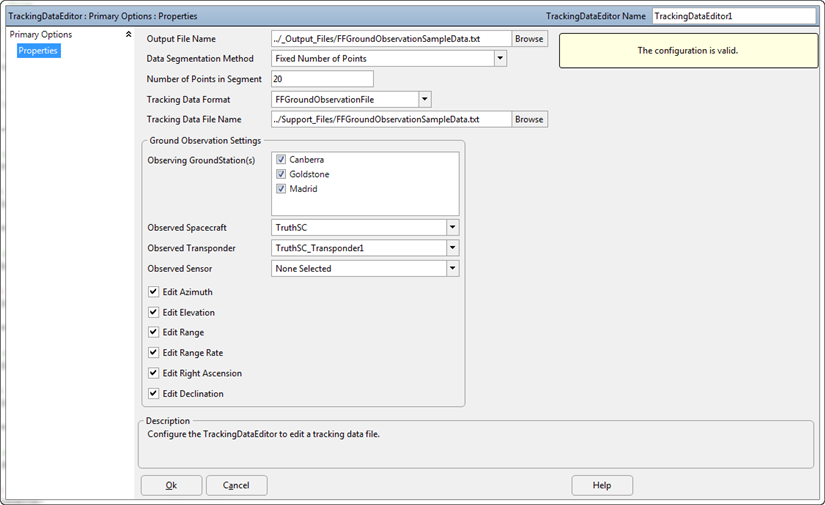
In the TrackingDataEditor object editor, you can set the format of the tracking data file and the input and output file names. Once the data format has been set, the panel will update to show additional inputs for configuring the corresponding type of Observation. Select the observer(s) and object(s) being observed to match what is expected from the file.
The Object Browser will display a message letting you know whether the Tracking Data Editor configuration is valid or invalid.

Object Editor for the TrackingDataEditor
A Tracking Data Editor can be also be created and configured in FreeFlyer script:
TrackingDataEditor TrackingDataEditor1;
// --- or ---
TrackingDataEditor TrackingDataEditor1(FFGroundObservationFile1); |
Data Segmentation Method
The available options are:
•Fixed Number of Points - Divides the data into passes using the user-specified number of points to determine the start and end of each pass •Fixed Duration - Divides the data into passes using the user-specified duration to determine the start and end of each pass •Detect Passes Based on Data Gap Duration - Divides the data into passes by looking for gaps in the data greater than or equal to the user-specified value •Process All Data Simultaneously - Presents all data as a single pass |
TrackingDataEditor1.DataSegmentationMethod = 2;
// 0 - Fixed Number of Points // 1 - Fixed Duration // 2 - Detect Passes Based on Data Gap Duration // 3 - Process All Data Simultaneously |
Default Data Type
The user can specify the default data type to show when the TrackingDataEditor is displayed.
TrackingDataEditor1.DefaultDataType = 1; // 0 - Measurement, 1 - Residual |
Default Measurement Types
The user can specify the default measurement types to show when the TrackingDataEditor is displayed. The syntax example below shows how to display the TrackingDataEditor with Range and RangeRate measurements for a FFGroundObservationFile.
TrackingDataEditor1.NumberOfDefaultMeasurementTypes = 2; TrackingDataEditor1.DefaultMeasurementTypes = {"GroundStation:Range", "GroundStation:RangeRate"}; |
Data Scaling Modes
The user can scale the data for each type (Measurement or Residual) of data displayed. This allows the user to view all of the data simultaneously.
Residual Scaling
The residual data can be scaled by normalizing the data or by the measurement noise.
TrackingDataEditor1.ResidualScalingMode = 0; // 0 - No Scaling // 1 - Normalize Scale // 2 - Scale By Noise |
Scaling the residuals by noise provides the same result as performing 1-sigma threshold editing. See the sigma threshold editing section for more information.
Measurement Scaling
The measurement data can be scaled by normalizing the data.
TrackingDataEditor1.MeasurementScalingMode = 0; // 0 - No Scaling // 1 - Normalize Scale |
Supported Tracking Data Formats
The TrackingDataEditor supports several Tracking Data File Formats:
|
•BRTSUTDFFile (Only as a List of observations, as demonstrated below) |
The user can specify the tracking data file using the syntax below:
TrackingDataEditor TrackingDataEditor1(FFGroundObservationFile1);
// --- or ---
TrackingDataEditor1.SetTrackingDataFile(FFGroundObservationFile1); |
The TrackingDataEditor can also work with a List of observations, which does not require a tracking data file. The user can specify a List of observations using the syntax below:
BRTSUTDFFile BRTSUTDFFile1;
List<BRTSObservation> BRTSObservationsList;
BRTSUTDFFile1.GetAllObservations(BRTSObservationsList);
TrackingDataEditor1.Show(BRTSObservationsList); |
Sigma Threshold Editing
The TrackingDataEditor provides the ability to view scaled sigma residuals. The user can specify a sigma level for auto-editing of data and perform editing without showing the tracking data editor.
TrackingDataEditor1.PerformSigmaEditing(3); // 3-sigma scaling
// --- or ---
TrackingDataEditor1.Show(3); // Perform Sigma Editing (3-sigma) when the TrackingDataEditor is displayed |
Once the TrackingDataEditor has been displayed, the user can enable or disable the sigma threshold editing as seen in the image below. The user can also change the threshold value.
![]()
Showing the Tracking Data Editor
A Tracking Data Editor can be displayed to the user via the Show command, as seen in the syntax example below:
Show TrackingDataEditor1; |
The user can also specify the tracking data file or a List of observations when the Tracking Data Editor is displayed.
TrackingDataEditor1.Show(FFGroundObservationFile1); // FFGroundObservationFile
// --- or ---
TrackingDataEditor1.Show(GroundStationObservationList); // List of GroundStationObservations |
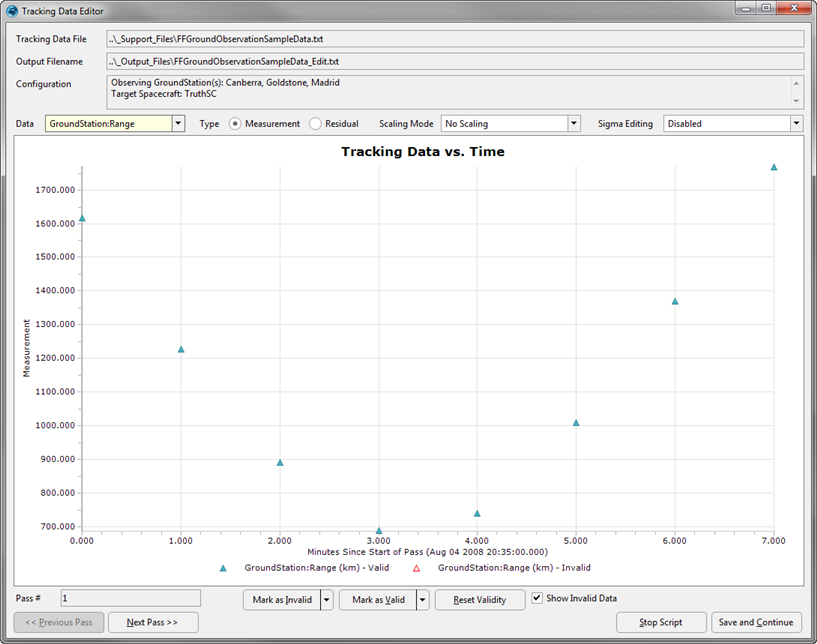
When the Mission Plan is run, this line will cause the editor to appear. At the top of the panel, the editor displays information including the input file name and the observing and observed objects. Below that, various controls allow the user to edit the data and ultimately generate a new output file.
Using the controls shown above the plot, the user can view the start date of the currently plotted pass and set the data type to be displayed on the plot. The available data types will be different depending on the type of observation; for the GroundStation observation examined in the image below, the data types are Azimuth, Elevation, Range, and Range Rate. For each of these data types, the user can decide to view the measurements directly or the residuals.

Sample Tracking Data Editor showing Range Measurements
Below the plot, the user has access to controls which allow them to:
•Navigate between passes •Mark all the data points currently in view as Valid or Invalid •Reset the Validity •Stop the Mission Plan •Save the edited data to the TrackingDataEditor output file and continue with the Mission Plan |
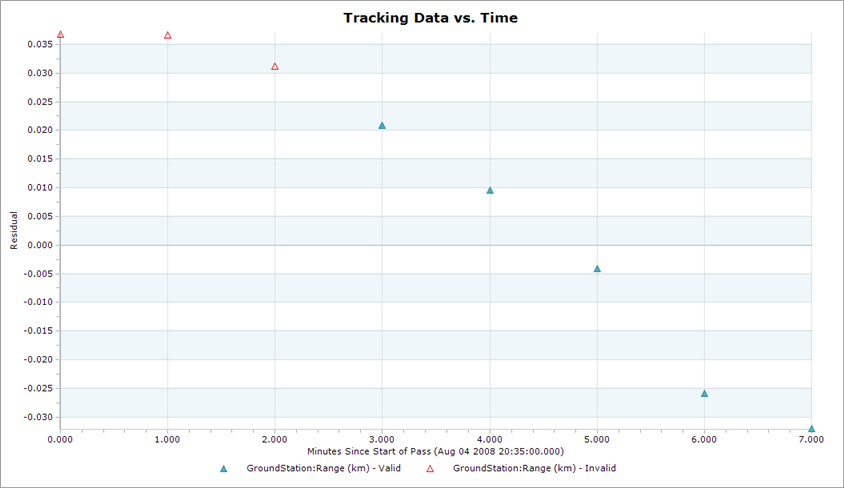
In the image below, the user has zoomed in on three outlying range residuals data points and used the "Mark as Invalid" button to edit out the points (indicated in red).

Tracking Data Editor Plot showing three edited data points
See Also
•TrackingDataEditor Properties and Methods |