The FreeFlyer Debugger allows you to examine the status of a Mission Plan during a run. You can view and edit the values of FreeFlyer objects and properties, without the need for extra Report commands. The Debugger includes two primary features: MouseOver and the Inspector.
Launching the Debugger
The Debugger is not launched by default. There are four ways to launch the Debugger:
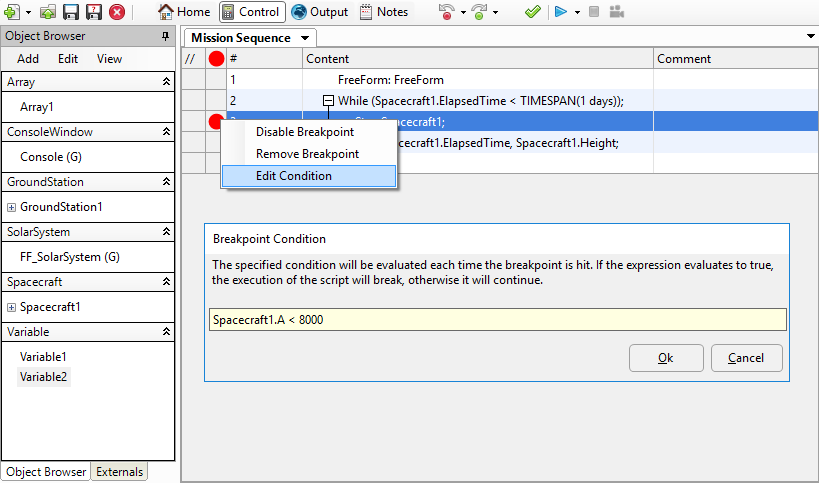
1.Set breakpoints - click in the left margin of a Mission Sequence or FreeForm editor, then Run the Mission Plan.
2.Run and Break into Debugger - behaves as though there is a breakpoint at the first line of code. 3.Right-click at the desired line of any FreeForm Script Editor and select "Run to Cursor".
4.Run the Mission Plan, then Pause and return to the Control screen. Click the Break icon on the Debugger Toolbar. |
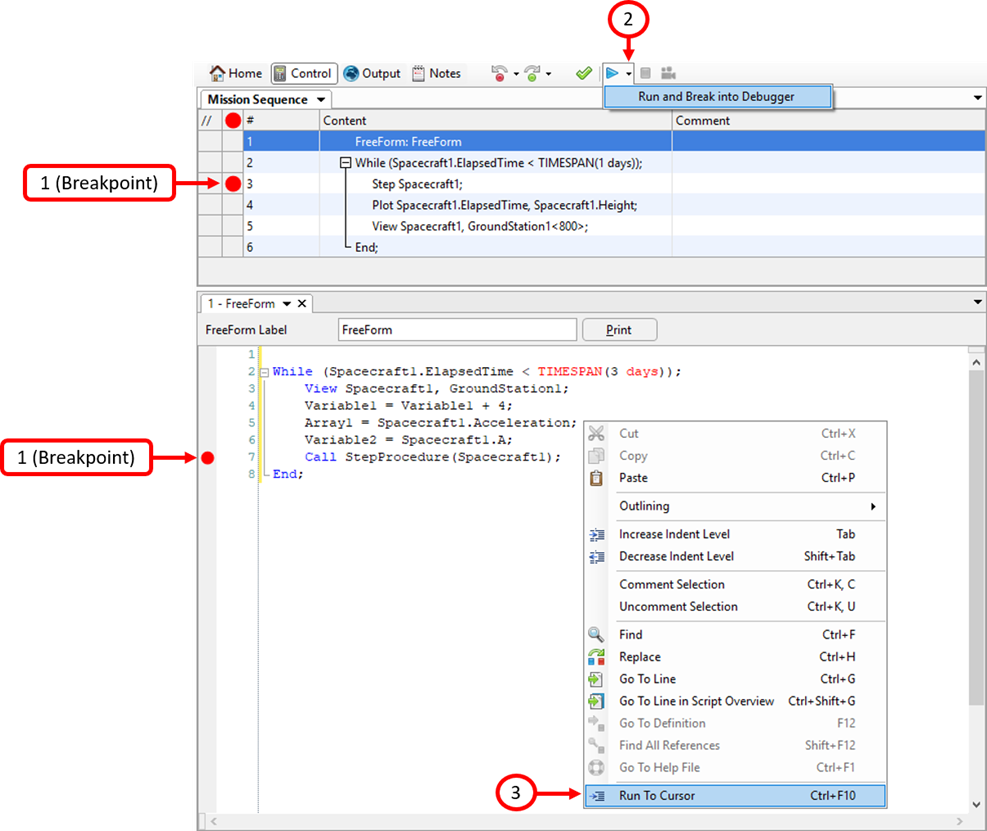
Debugger Breakpoints
Debugger Toolbar
1.Break: Break into Debugging Mode 2.Continue: Run until next breakpoint 3.Step Over: Proceed through main Mission Sequence line-by-line; Procedures are evaluated in a single step 4.Step Into: This option becomes available at a Call to a Procedure, as seen in the image below; Steps line-by-line through a Procedure 5.Step Out: Return from a Procedure to the main Mission Sequence |
The yellow arrow indicates the current position in the Mission Plan.
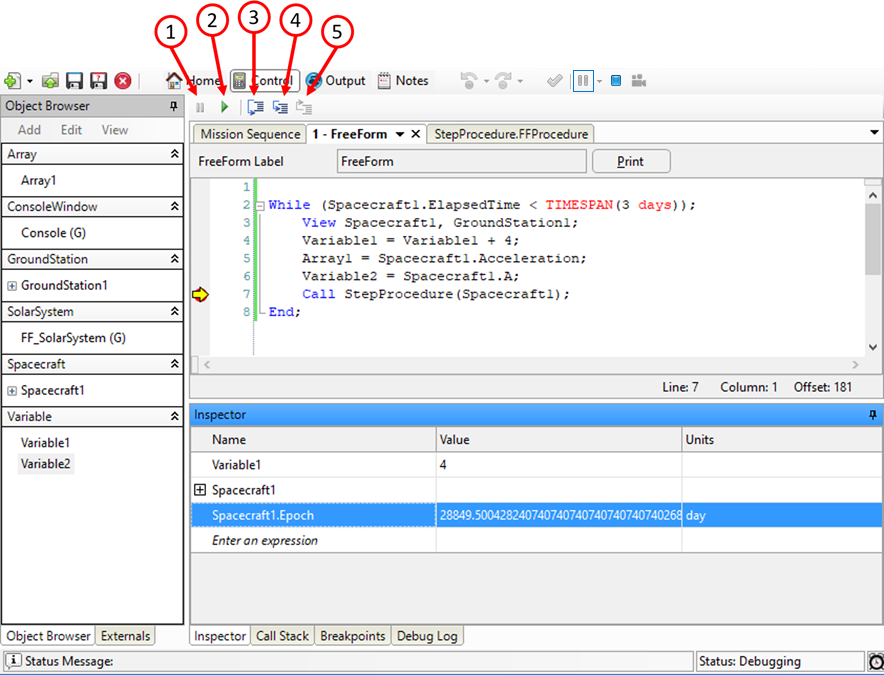
Debugger Toolbar and Tabs
Using MouseOver
Hover the mouse over an object or property to see its current status, as shown in the image below.
•For Array, StringArray, and List objects, the Length is shown •For other objects and object properties, the value is shown |
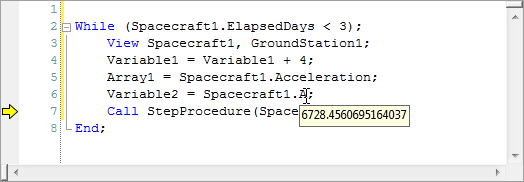
Composite Image of MouseOver for Variable1, Array1, and Spacecraft1.A
The Inspector
To bring up the Inspector seen in the images below, you must first launch the Debugger.
The Inspector is divided into four columns:
1.Name 2.Value (For Array, StringArray, and List objects, Length is shown) 3.Units (km, days, rad, ...) 4.Type (Variable, Spacecraft, number, ...) |
There are several ways to examine objects or properties in the Inspector:
•Drag-and-drop from FreeForm •Drag-and-drop from Object Browser •Manually type in an expression, such as: oSpacecraft1.A oSpacecraft1.Contact(GroundStation1) orad(180) oVariable1 + 2*Variable2 •When an object, such as Spacecraft1, has been added to the Inspector, toggle the plus/minus symbol to expand the object and view its properties. oTo bring one of these properties up to the first level of the Inspector, select-and-drag the property until a "+" sign is shown, as seen in the image below. |
The list of Inspected objects and properties persist from previous executions of the Mission Plan.
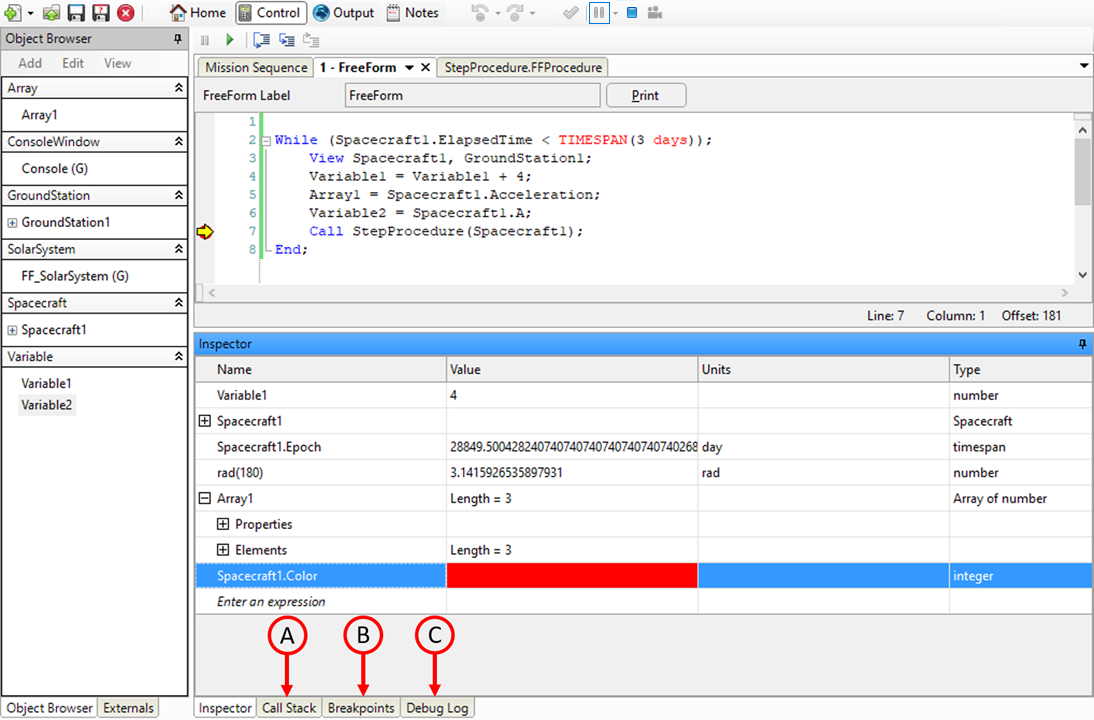
Debugger Inspector
Overwriting Values
You can use the Inspector to assign new values to objects and properties. For example, you can change the tail color of a Spacecraft to be orange, or overwrite the value of the semi-major axis, Spacecraft1.A. Related properties, such as the semi-major axis in other element sets, will be updated based on the most recently entered value.
Call Stack Tab (A)
Displays the current level of the Mission Plan, including:
•Scope (Main, Procedure, ...) •Source (Mission Plan, path to Procedure file, ...) •Line Number |
Breakpoints Tab (B)
Displays all breakpoints in the Mission Plan, with their line number and the option to Enable/Disable them. You can also enable/disable a breakpoint by right-clicking it.
Debug Log (C)
You can report information to the Debugger Log Window using the Report command. The DebuggerLog object is an instance of this global object type; see the Working with Objects Guide for more information.
Report mySpacecraft.A to DebuggerLog; |
See Also
•Debugger Shortcuts in the Appendix |
