Generate Output
You can create visual, graphical, or numerical output in a variety of ways with FreeFlyer. For this tutorial, you will create a 3D View and 2D View of your spacecraft propagation and you will create a plot to show how the spacecraft height changes over time.
-
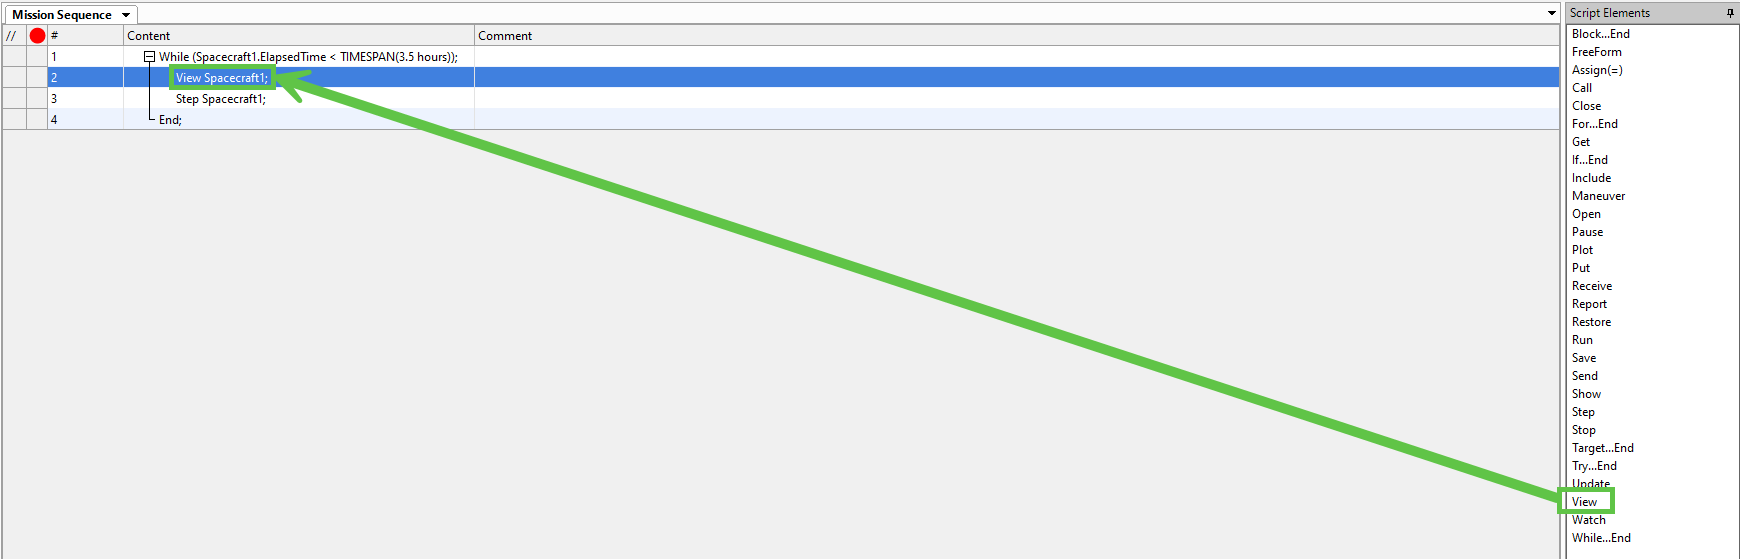
Under Script Elements, drag and drop a View command inside the While Loop in the Mission Sequence.
-
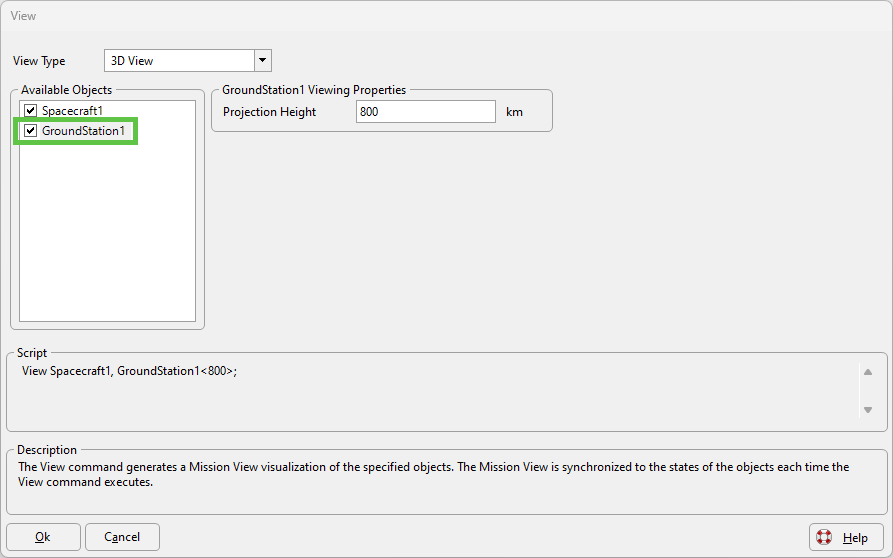
Double-click on the View command in the Mission Sequence to open the graphical user interface editor.
-
Check the box next to "GroundStation1" to add the ground station to your 3D View.
-
Select "Okay" to save your changes and close the View command editor.
-
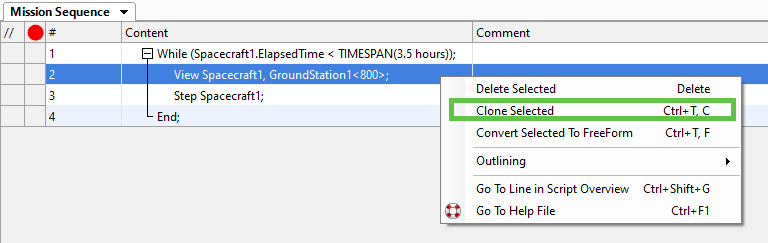
Right-click on the View command in your Mission Sequence and select "Clone Selected".
-
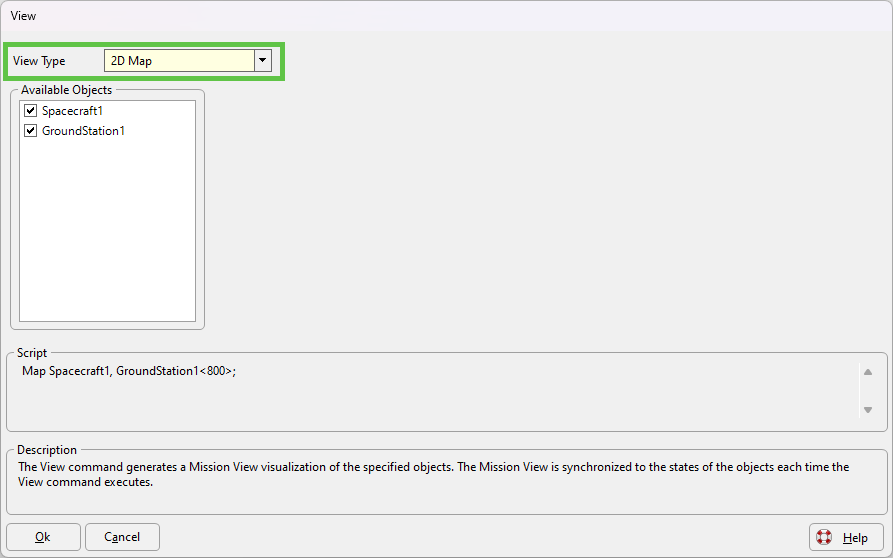
You now have two identical View commands in your Mission Sequence. Double-click on one of the View commands to open the graphical user interface editor, then use the drop down arrow next to View Type and select "2D Map".
-
Select "Okay" to save your changes and close the View command editor.
-
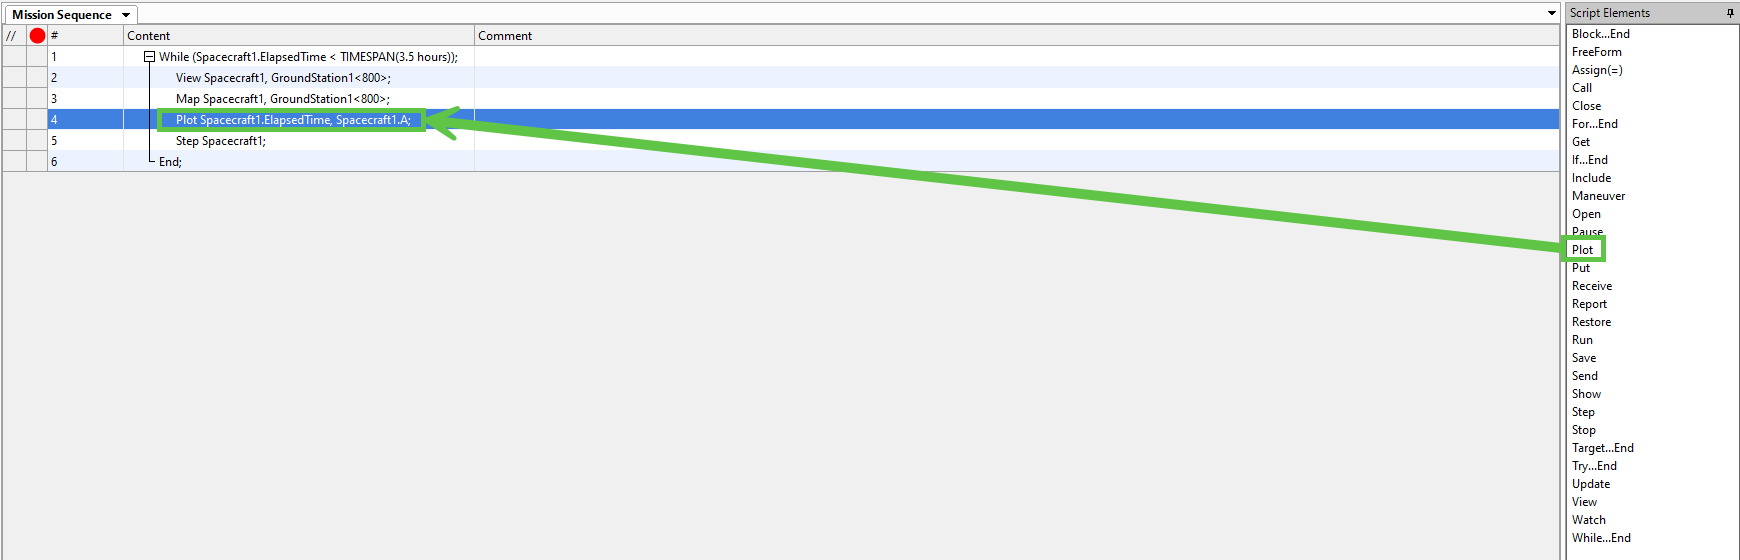
Under Script Elements, drag and drop a Plot command inside the While Loop in the Mission Sequence.
-
Double-click the Plot command in the Mission Sequence to open the graphical user interface editor. Use the drop down arrow next to Spacecraft1.A to edit the value of the Y-Axis. Select "Height" for the property.
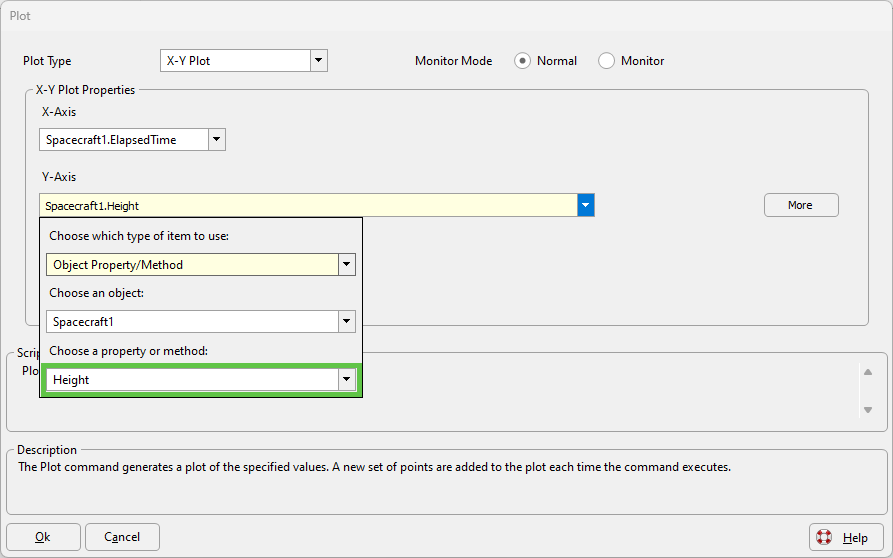
Tip: While in the drop down menu, you can enter "H" on your keyboard to automatically scroll to the properties that begin with the letter "H".
-
Select "Okay" to save your changes and close the Plot command editor.
-
Select the Run Icon
 from the Navigation Bar or enter CTRL + R
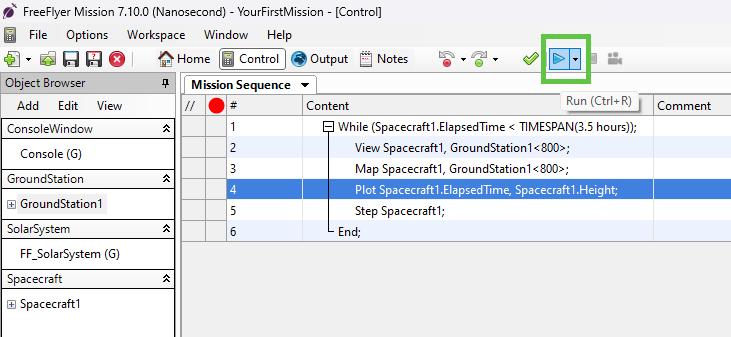
-
Congratulations! You created your first Mission Plan. Explore the output on the Control Screen then continue to the next section of this guide to make your Mission Plan even more comprehensive.
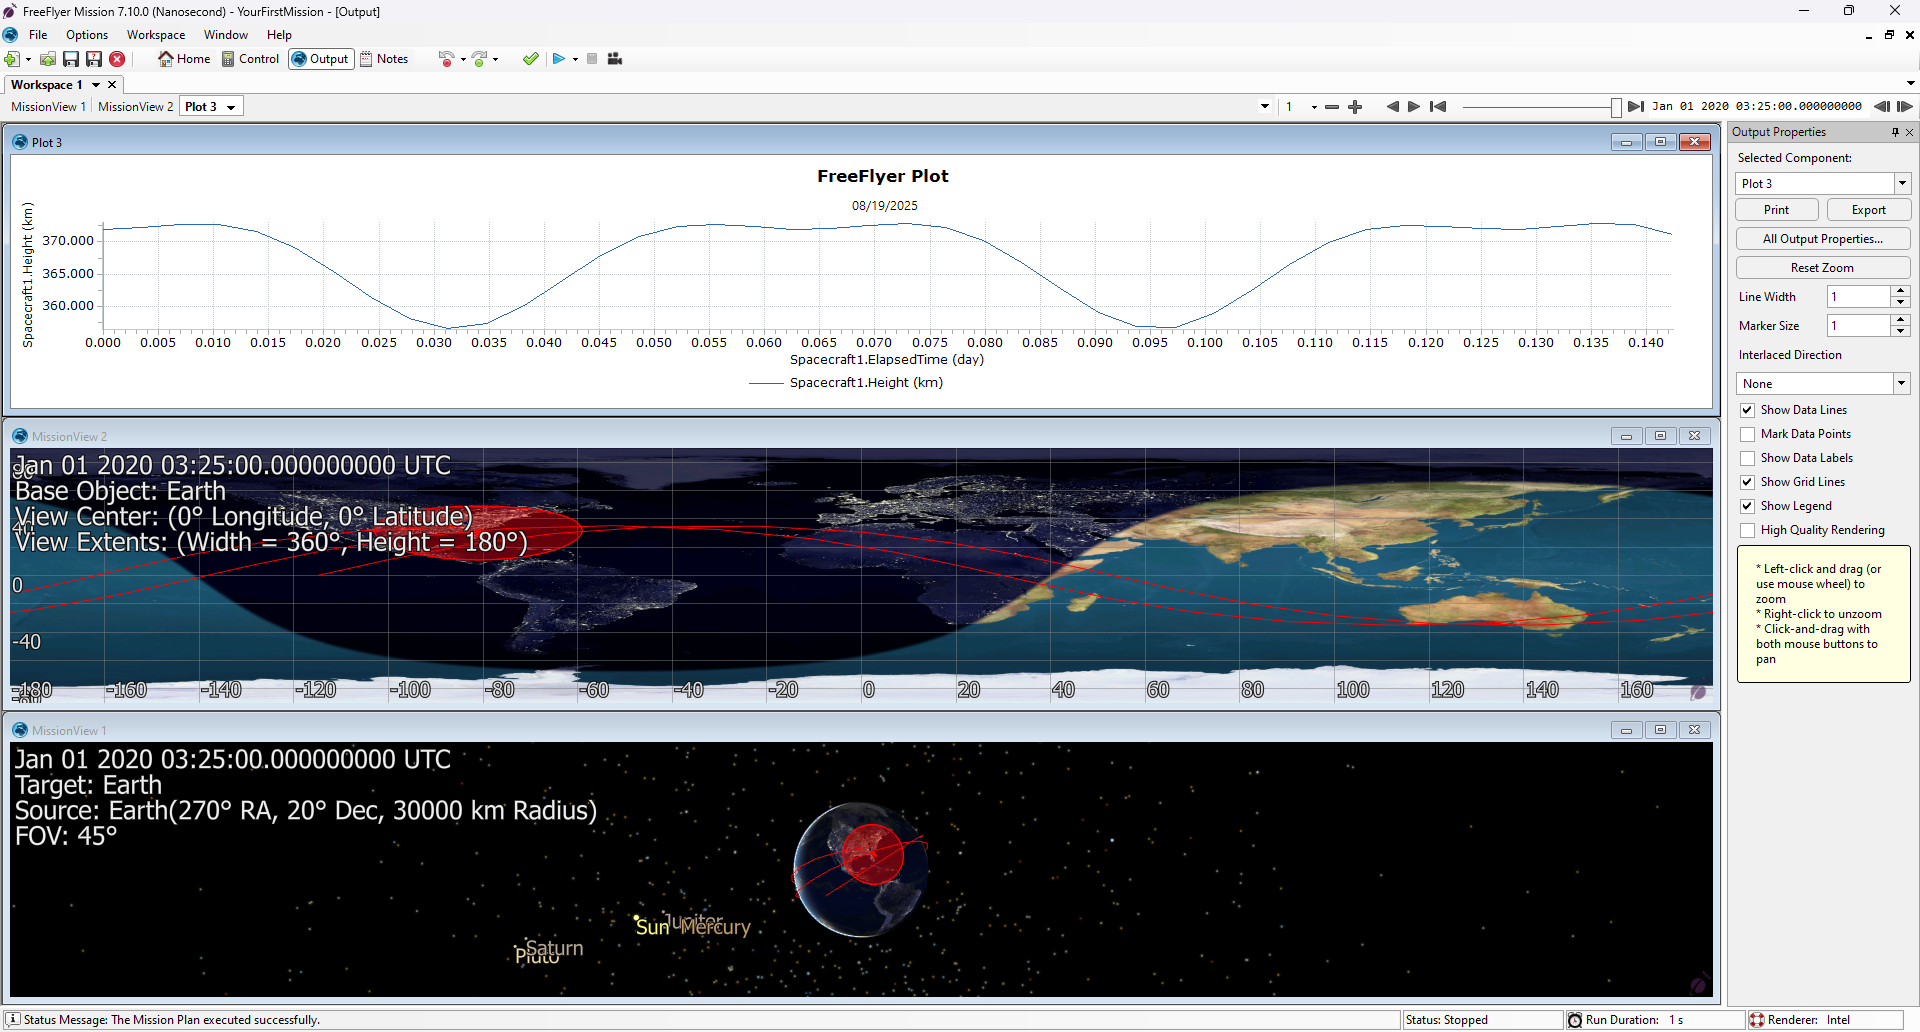
Note: Use the Replay Toolbar
 to play back and scrub through the output after your Mission Plan has executed.
Tip: Right-click on your output windows and select "Reconnect Automation" to reset the view after interacting with a ViewWindow.